Past Question Paper
| Dear Students, If you find any question paper missing from any year, please contact us through our email address “bhmaims@gmail.com“ Also, if you have any missing past-year board question papers, kindly forward them to us so that we can update in our website. |
Statistics Year 2017 Question Paper
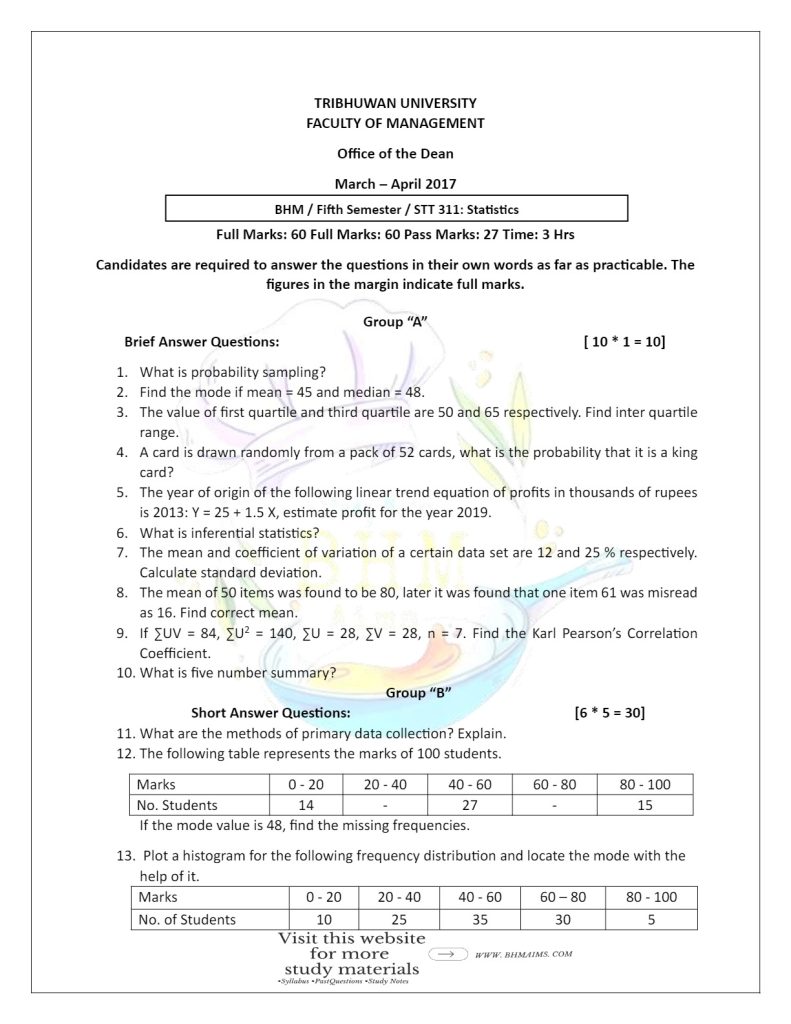
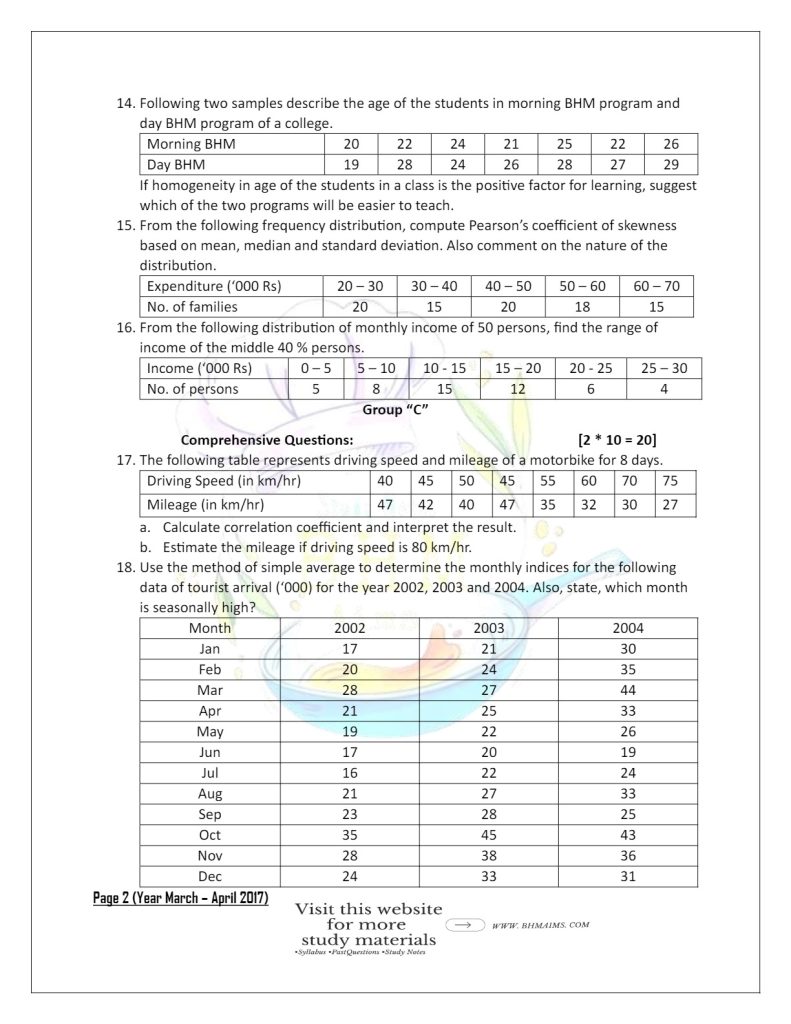
Statistics Year 2018 Question Paper
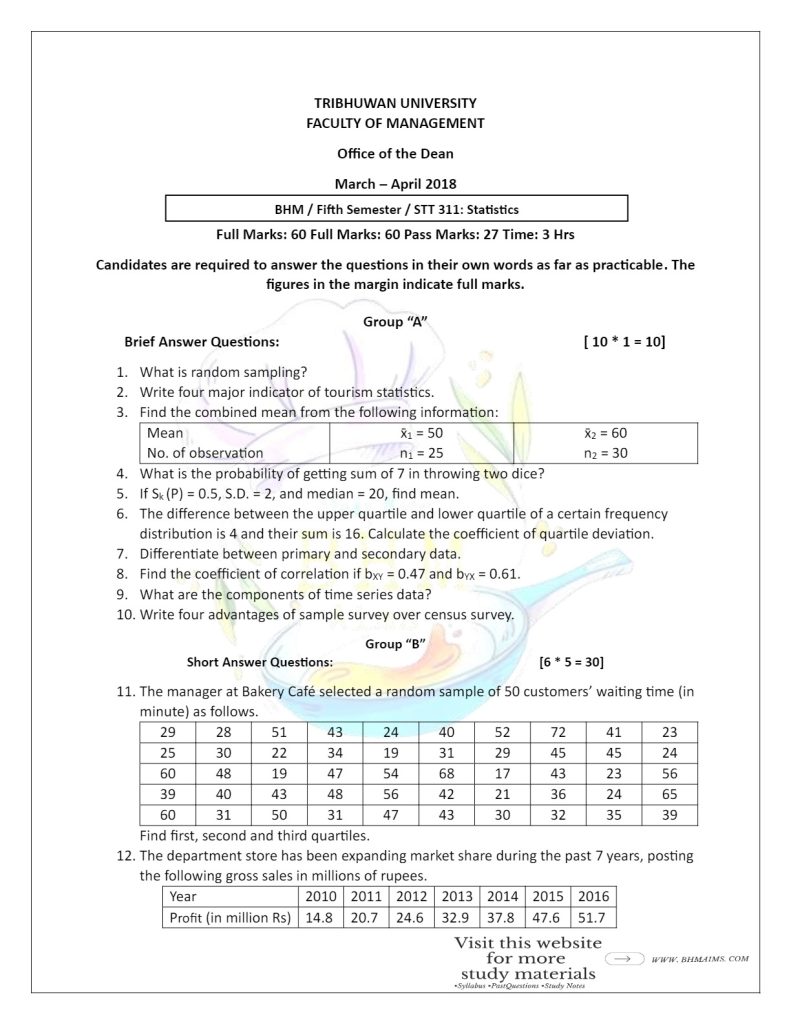
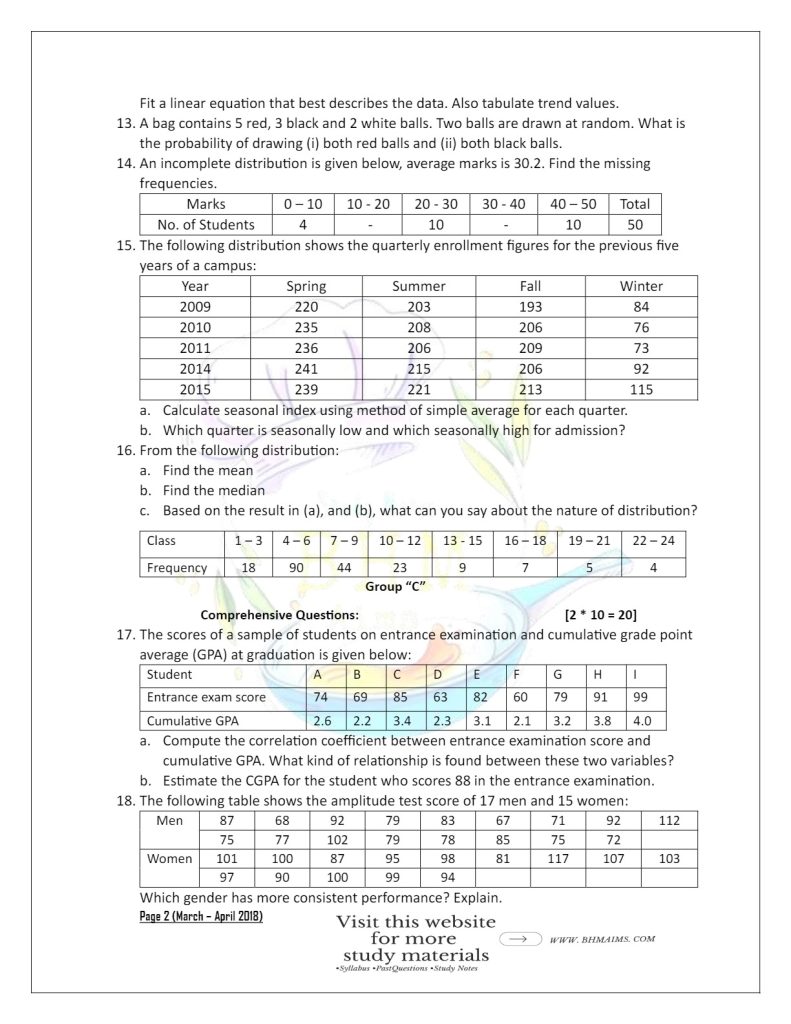
Statistics Year 2019 Question Paper
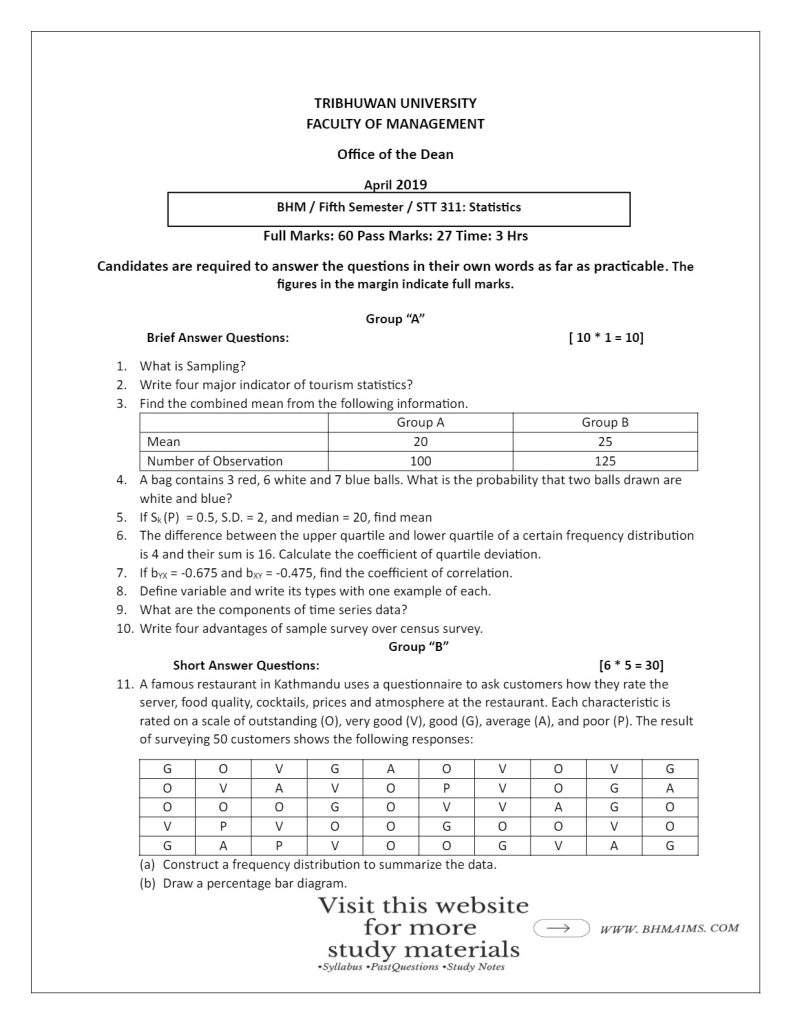
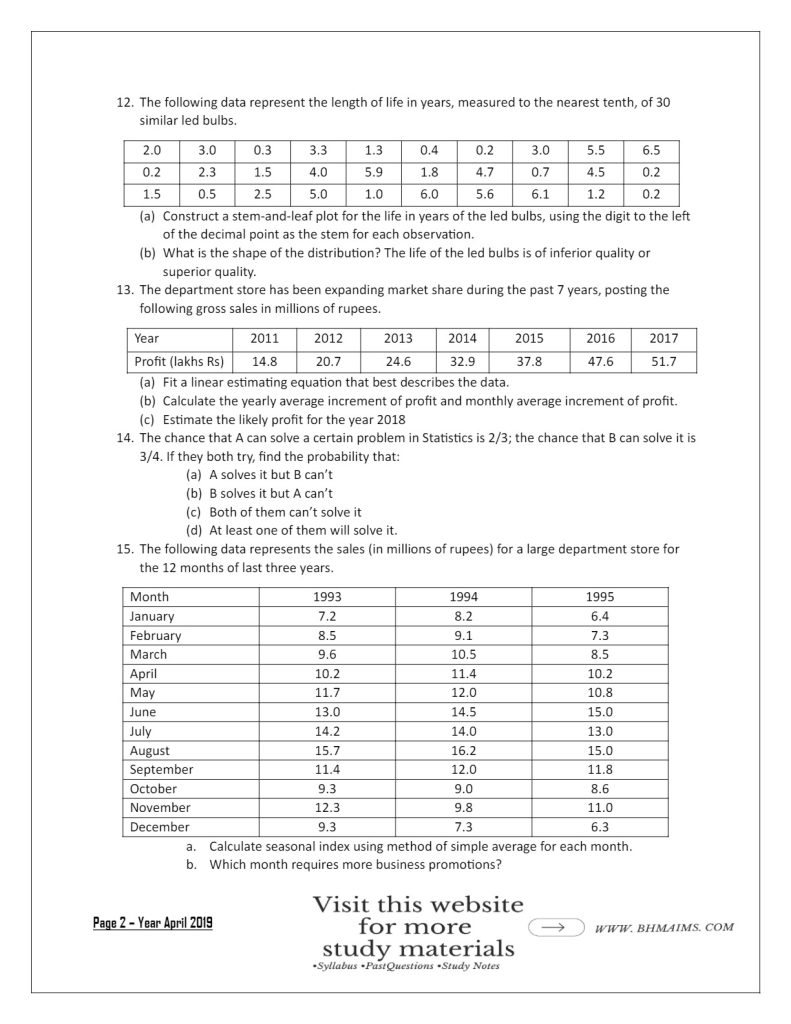
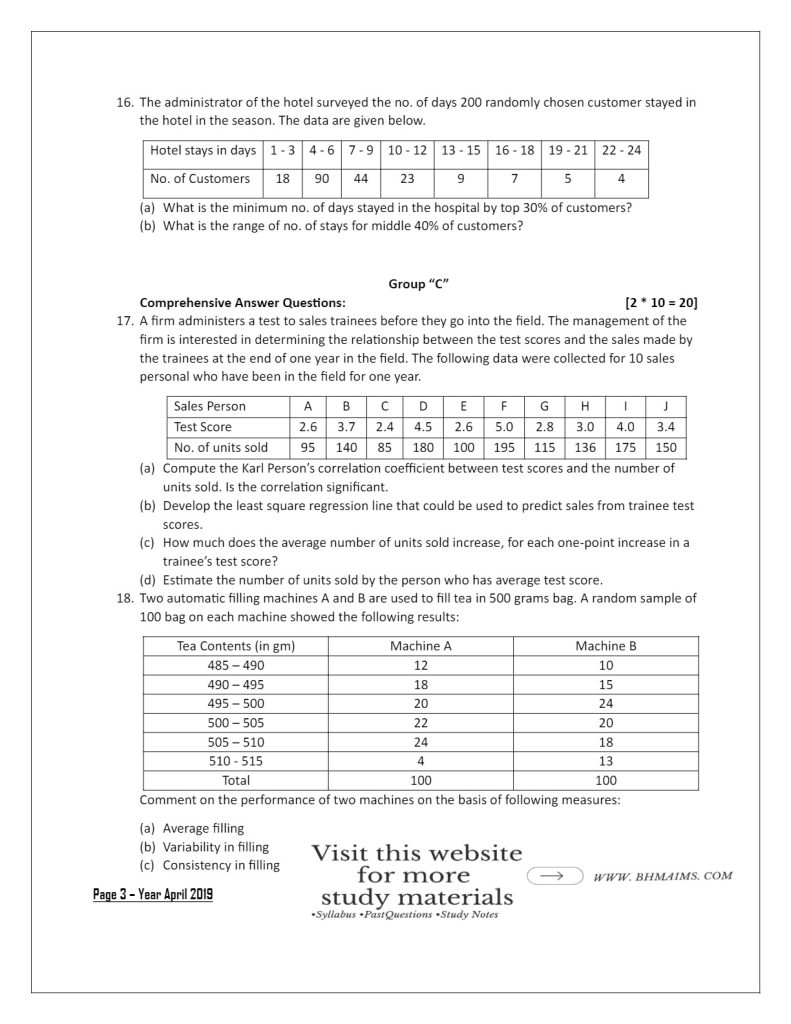
Statistics Year 2022 Question Paper
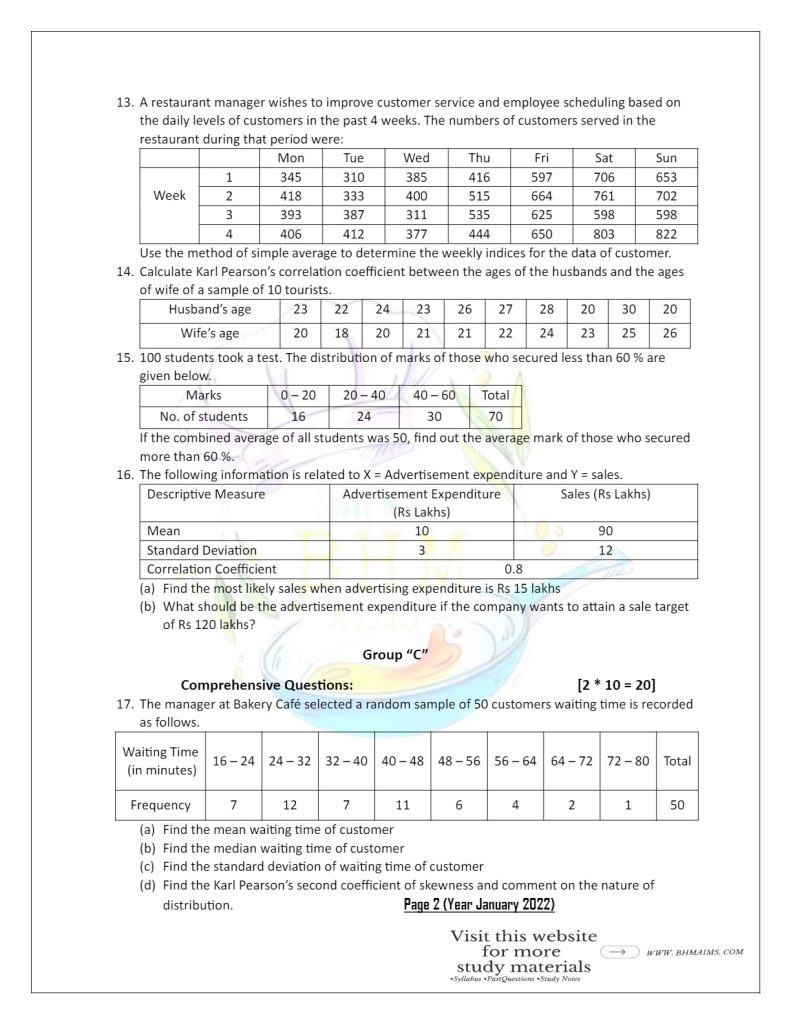
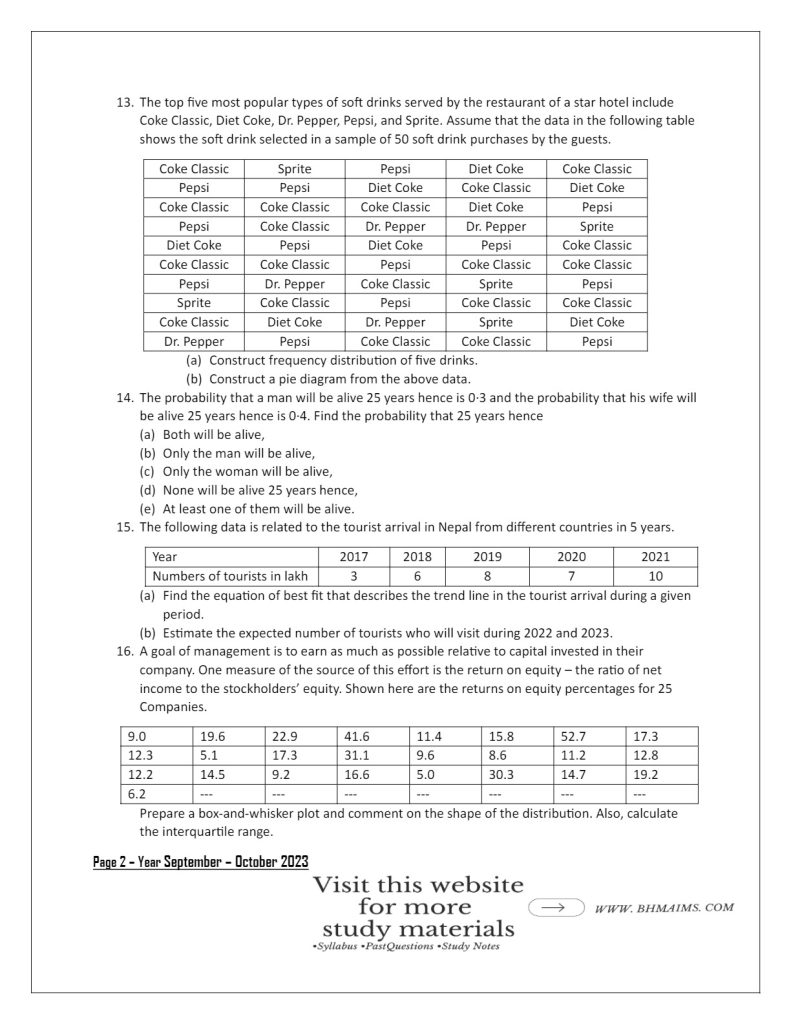
Statistics Year 2023 Question Paper

Solved Solution
Solution of Year 2017
- What is probability sampling?
Probability sampling is the type of sampling technique in which each and every unit of the population is equally likely i.e. each unit has equal probability of selection. - Find the mode if mean = 45 and median = 48.
Solution
Given,
Mean= 45
Median = 48
We know,
| Mode = 3 Median – 2 Mean |
= 3 * 48 – 2 * 45
= 144 – 90
= 54
- The value of first quartile and third quartile are 50 and 65 respectively. Find inter quartile range.
Solution
Given,
1st quarter (Q1) = 50
3rd quarter (Q3) = 65
We know,
Interquartile range = Q3 – Q1
= 65 – 50
= 15
- A card is drawn randomly from a pack of 52 cards, what is the probability that it is a king card?
Solution
Total exhaustive cases (n) = 52
Total favorable cases of getting a king card (m) = 4
We know,
P(King) = m/n
= 4 / 52
= 1 /13
- What is inferential statistics?
Inferential statistics are defined as the theoretical classification of statistics in which samples are taken from the population in such a way that the drawn sample can represent the entire population.
For example: Predicting the average age of everyone in the city taking survey of only few people. - The mean and coefficient of variation of a certain data set are 12 and 25 % respectively. Calculate standard deviation.
Solution
Coefficient of variation (CV) = 25
Mean (x̄) = 12
Standard deviation (σ ) = ?
We know,
Coefficient of variation (CV) = ( σ / x̄ ) * 100
or, 25 = ( σ / 12 )*100
or, 25 * 12 = 100σ
or, 300 /100 = σ
∴ σ = 3
Hence, the standard deviation is 3. - The mean of 50 items was found to be 80, later it was found that one item 61 was misread as 16. Find correct mean.
Solution
No. of item (n) = 50
Misread item = 16
Correct item = 61
Mean (x̄) = 80
We have,
Mean (x̄) = ∑x / n
or, 80 = ∑x / 50
or, 80 * 50 = ∑x
∴ ∑x = 4000
Hence, ∑x from misread items is 4000
Again,
Correct ∑x = 4000 – 16 + 61
= 4045
Correct Mean = Correct ∑x /Correct n
= 4045/ 50
= 80.9
∴ Hence, the correct mean is 80.9 - If ∑UV = 84, ∑U2 = 140, ∑V 2= 140, ∑U = 28, ∑V = 28, n = 7. Find the Karl Pearson’s Correlation Coefficient.
Solution
We have all the required information:
∑UV = 84
∑U2 = 140
∑V 2= 140
∑U = 28
∑V = 28
n = 7
We know that,
r = [ n∑UV – (∑U) (∑V) ] / [√{n∑U2 – (∑U)2 } √{ n∑V2 – (∑V)2 }]
= [ 7 * 84 – (28 * 28) ] / [√{ 7 * 140 – (28)2 } √{ 7 * 140- (28)2 }]
= [ 588 – 784 ] / [√{ 980 – 784 } √{ 980 – 784 }]
= -196 / [√ 196 * √ 196]
=-196 / [14 * 14]
= -196 / 196
= -1
Hence, the Karl Pearson’s Correlation Coefficient is -1, which means perfect negative correlation.
- What is five number summary?
A five-number summary is a statistical summary of a dataset that provides a quick overview of its distribution. It includes the following five values:- Minimum: The smallest value in the dataset.
- First Quartile (Q1): The 25th percentile, which is the value that separates the lowest 25% of the data from the rest.
- Median (Q2): The 50th percentile, which is the middle value of the dataset when it is ordered from least to greatest.
- Third Quartile (Q3): The 75th percentile, which separates the lowest 75% of the data from the top 25%.
- Maximum: The largest value in the dataset
- What are the methods of primary data collection? Explain.
The methods of primary data collection are:- Direct personal interview method: The Direct Personal Interview Method is a method of data collection where the investigator personally meets the respondents and collects the required information through face-to-face interviews. In this approach, the interviewer asks questions directly to the respondent and records their answers in real time. It is one of the most effective methods for gathering detailed and accurate data.
- Indirect oral interview method: The Indirect Personal Interview Method is a data collection technique where the investigator does not interview the respondents directly but gathers information through intermediaries or third parties (called as ‘witness’) who have knowledge about the respondents. This method is often used when it is difficult or impractical to approach the respondents directly.
This method is applied in the situation when the informants hesitate to provide information directly. Information regarding the property, income, personal habits such as smoking habits, drug addicts, using family planning measures, etc. - Information through correspondence: Information through Correspondence is a data collection method where the investigator gathers information by sending letters, emails, or other forms of written communication to respondents. The respondents provide the required information by replying to the correspondence. This method is commonly used when personal interviews are impractical due to geographical distances or time constraints.
This method is more suitable in the field of news media. - Mailed questionnaire method: A set of questions is prepared and is known as questionnaire. The Mailed Questionnaire Method is a data collection technique where a set of pre-structured questions (a questionnaire) is sent to respondents by mail or email. The respondents are asked to fill out the questionnaire and return it to the investigator. This method is often used in large-scale surveys where personal interviews would be too expensive or time-consuming.
- Schedule sent through enumerators: The Schedule Sent Through Enumerators Method is a data collection technique where trained individuals, known as enumerators, visit respondents in person with a prepared list of questions (schedule). The enumerators ask the questions and record the respondents’ answers. This method is often used in large-scale surveys, censuses, or when respondents might not be literate or able to complete a questionnaire on their own.
- The following table represents the marks of 100 students.
| Marks | 0 – 20 | 20 – 40 | 40 – 60 | 60 – 80 | 80 – 100 |
| No. Students | 14 | – | 27 | – | 15 |
Solution
| Marks (x) | No of Students (f) | cf |
|---|---|---|
| 0 – 20 20 – 40 40 – 60 60 – 80 80 – 100 | 14 a (f0) 27 (f1) b (f2) 15 | 14 14 + a 41 + a 41 + a + b 56 + a + b |
| N = 56 + a + b |
From the table,
Total frequency = 56+ f0 + f2
or, 100 = 56 + a+ b
∴ a+ b= 44 ——– Suppose, equation (i)
By the given value of mode = 48, which lies in the class 40 – 60.
Here,
L = 40
f0 = a
f1 = 27
f2 = b
h = 60 – 40 = 20
Mode = 48
Now,
Mode = L + [(f0 – f1) / (f0 – f1) + (f0 – f2)]* h
or, 48 = 40 + [(27 – a) / (27 – a) + (27 – b)]* 20
or, 8 = [(27 – a) / (27 – a) + (27 – b)]* 20
or, 8 = (27 * 20 – 20 * a )/ 27 – a+ 27 – b
or, 8 = 540 – 20a / 54 – a – b
or, 8 (54 – a – b) = 540 – 20a
or, 432 – 8a -8b = 540 – 20a
or, 20a – 8a – 8b = 540 -432
or, 12a – 8b = 108 ——– Suppose, equation (ii)
Solving equation i
a + b = 44
or, a = 44 – b
Substituting value of a in equation ii
12a – 8b = 108
12 (44 – b) -8b = 108
or, 528 – 12b – 8b = 108
or, 528 – 20b = 108
or, 528 – 108= 20b
or, b = 420 / 20
∴ b = 21
Putting value of b in equation i
a + b = 44
or, a + 21 = 44
or, a = 44 – 21
∴ a = 23
Hence, the missing frequencies are 23 and 21.
- Plot a histogram for the following frequency distribution and locate the mode with the help of it.
| Marks | 0 – 20 | 20 – 40 | 40 – 60 | 60 – 80 | 80 – 100 |
| No. of Students | 10 | 25 | 35 | 30 | 5 |
Solution
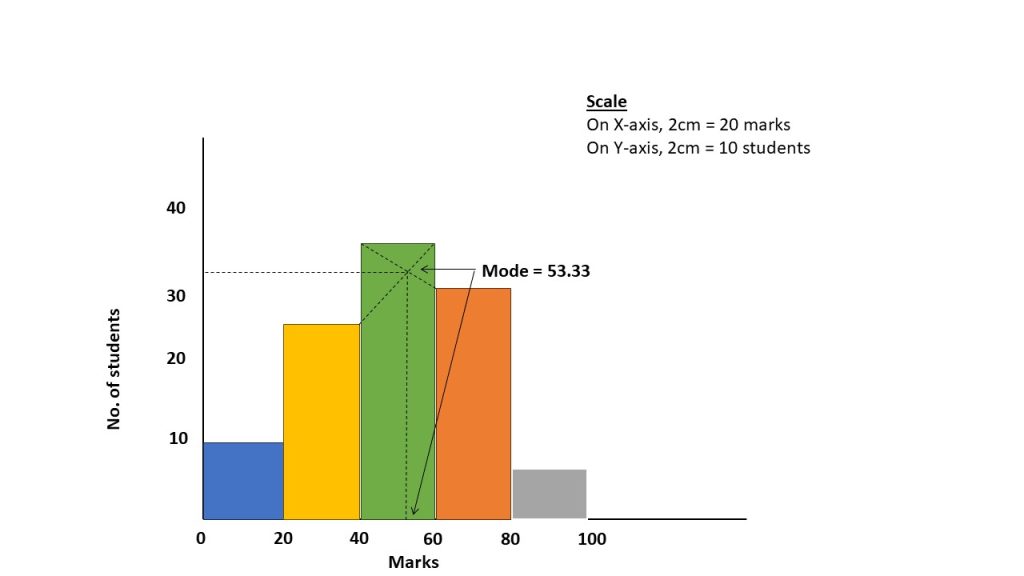
| NOTE : You don’t have to do below calculation in this question because this question only ask to draw histogram. Just make above figure / chart. |
| Marks (x) | No. of stds (f) | cf |
|---|---|---|
| 0 – 20 20 – 40 40 – 60 60 – 80 80 – 100 | 10 25 35 30 5 | 10 35 70 100 105 |
| n = 105 |
Here,
L = 40
f0 = 35
f1 = 25
f2 = 30
h = 60 – 40 = 20
We know
Mode = L + [( f0 – f1 ) / (2 f0 – f1 -f2 )] * h
= 40 + [( 35 – 25 ) / (2 * 35 – 25 -30 )] *20
= 40 + [10 /15] * 20
= 40 + (200 /15)
= 40 * 15 + 200 / 15
= 53.33
- Following two samples describe the age of the students in morning BHM program and day BHM program of a college.
| Morning BHM | 20 | 22 | 24 | 21 | 25 | 22 | 26 |
| Day BHM | 19 | 28 | 24 | 26 | 28 | 27 | 29 |
Solution
Calculation of range for both shifts
| In morning BHM, Maximum age = 26 Minimum age = 20 Range = Xmax – Xmin = 26 – 20 = 6 | In Day BHM, Maximum age = 29 Minimum age = 19 Range = Xmax – Xmin = 29 – 19 = 10 |
Calculation of Standard Deviation
| Morning Shift | Day Shift | ||
| X | X2 | X | X2 |
| 20 22 24 21 25 22 26 | 400 484 576 441 625 484 676 | 19 28 24 26 28 27 29 | 361 784 576 676 784 729 841 |
| ∑X = 160 | ∑X2 = 3686 | ∑X = 181 | ∑X2 =4751 |
Meanmorning (x̄morning) = ∑X / n
= 160 / 7
= 22.85
MeanDay (x̄Day) = ∑X / n
= 181/ 7
= 25.85
Then,
SD (σmorning) = √ [(1/n) ∑X2 – (x̄)2]
= √ [(1/7) 3686 – (22.85)2]
= 2.10
SD (σday) = √ [(1/n) ∑X2 – (x̄)2]
= √ [(1/7) 4751 – (25.85)2]
= 3.23
Since the Morning BHM Program has a lower range and lower standard deviation, it indicates less variability in the ages of students, suggesting that it is more homogeneous compared to the Day BHM Program. Therefore, the Morning BHM Program would likely be easier to teach in terms of age-related homogeneity.
- From the following frequency distribution, compute Pearson’s coefficient of skewness based on mean, median and standard deviation. Also comment on the nature of the distribution.
| Expenditure (‘000 Rs) | 20 – 30 | 30 – 40 | 40 – 50 | 50 – 60 | 60 – 70 |
| No. of families | 20 | 15 | 20 | 18 | 15 |
Solution
As per the question, we need to first calculate mean, median and standard deviation.
Calculation of Mean
| Expenditure (Rs ‘000) | Mid value (X) | No. of families (f) | cf | fX | fX2 |
|---|---|---|---|---|---|
| 20 -30 30 – 40 40 – 50 50 – 60 60 – 70 | 25 35 45 55 65 | 20 15 20 18 15 | 20 35 55 73 88 | 500 525 900 990 975 | 12500 18375 40500 54450 63375 |
| N = 88 | ∑fx = 3890 | ∑fX2=189200 |
We know,
Mean = ∑fx / N
= 3890 / 88
= 44.20 (Rs ‘000’)
Calculation of Median
Now,
N/2 = 88 / 2 = 44 ; which shows median lies between 40 -50
Here,
l = 40
h= 50 – 40 = 10
cf = 35
f = 20
We know,
Median (Md) = l + [(N/2 -cf) /f ]* h
= 40 + [(44 – 35) / 20] * 10
= 44.5 (Rs ‘000’)
Again, Calculation of standard deviation
σ = √ [∑fx2 / n – (∑fx /n)2]
= √ [189200/ 88 – (3890 / 88)2]
= √ [2150 -1954.04]
= √ 195.96
= 13.99
More, Pearson’s coefficient of skewness
| Sk = 3 (Mean – Median) / σ |
= 3 (44.20 – 44.5) / 13.99
= -0.064
The Pearson’s coefficient of skewness is approximately -0.0633, which indicates that the distribution is nearly symmetrical with a very slight left skew. This suggests that the data is fairly balanced around the mean, with a minimal tail on the lower side.
- From the following distribution of monthly income of 50 persons, find the range of income of the middle 40 % persons.
| Income (‘000 Rs) | 0 – 5 | 5 – 10 | 10 – 15 | 15 – 20 | 20 – 25 | 25 – 30 |
| No. of persons | 5 | 8 | 15 | 12 | 6 | 4 |
- The following table represents driving speed and mileage of a motorbike for 8 days.
| Driving Speed (in km/hr) | 40 | 45 | 50 | 45 | 55 | 60 | 70 | 75 |
| Mileage (in km/hr) | 47 | 42 | 40 | 47 | 35 | 32 | 30 | 27 |
Solution
| X | Y | x = X – x̄ | x2 | y | y2 | xy |
|---|---|---|---|---|---|---|
| 40 45 50 45 55 60 70 75 | 47 42 40 47 35 32 30 27 | -15 -10 -5 -10 0 5 15 20 | 225 100 25 100 0 25 225 400 | 9.5 4.5 2.5 9.5 -2.5 -5.5 -7.5 -10.5 | 90.25 20.25 6.25 90.25 6.25 30.25 56.25 110.25 | -142.5 -45 -12.5 -95 0 -27.5 -112.5 -210 -545 |
| ∑X = 440 | ∑Y = 300 | ∑x = 0 | ∑x2 = 740 | ∑y = 0 | ∑y2 = 410 | ∑xy = -545 |
Calculating Mean
| x̄ = ∑X / n = 440 / 8 = 55 | ȳ= ∑Y / n = 300/ 8 = 37.5 |
Now,
Correlation Coefficient (r) = ∑xy / (√ ∑x2) (√ ∑y2)
= -545 / (√ 740) (√ 410)
= -545 / (27.20 * 20.24)
= -545 / 550.528
= -545 / 550.528
= -0.98
The correlation coefficient between driving speed and mileage is approximately -0.98. This indicates a strong negative relationship between driving speed and mileage. As the driving speed increases, the mileage tends to decrease significantly.
b. Estimate the mileage if driving speed is 80 km/hr.
Solution
- Use the method of simple average to determine the monthly indices for the following data of tourist arrival (‘000) for the year 2002, 2003 and 2004. Also, state, which month is seasonally high?
| Month | 2002 | 2003 | 2004 |
| Jan | 17 | 21 | 30 |
| Feb | 20 | 24 | 35 |
| Mar | 28 | 27 | 44 |
| Apr | 21 | 25 | 33 |
| May | 19 | 22 | 26 |
| Jun | 17 | 20 | 19 |
| Jul | 16 | 22 | 24 |
| Aug | 21 | 27 | 33 |
| Sep | 23 | 28 | 25 |
| Oct | 35 | 45 | 43 |
| Nov | 28 | 38 | 36 |
| Dec | 24 | 33 | 31 |
Solution
| Month | 2002 | 2003 | 2004 | Monthly Average (2002 + 2003 + 2004) / 3 | Monthly indices |
|---|---|---|---|---|---|
| Jan Feb Mar Apr May Jun Jul Aug Sep Oct Nov Dec | 17 20 28 21 19 17 16 21 23 35 28 24 | 21 24 27 25 22 20 22 27 28 45 38 33 | 30 35 44 33 26 19 24 33 25 43 36 31 | 22.66 26.33 33 26.33 22.33 18.33 20.66 27 25.33 41 34 29.33 | 82.37 95.71 119.95 95.71 81.17 66.63 75.09 98.14 92.07 149.03 123.59 106.61 |
| 330.18 |
Here,
Overall average = 330.18 / 12
= 27.51
Now,
Monthly indices = (Average tourist arrival for the month / Overall average ) * 100
For example:
Index for January=(22.66 / 27.51) * 100 = 82.37
Index for February =(26.33 / 27.51) * 100 = 95.71
Highest index: The month with the highest index is October, with an index of 149.03.
Conclusion: October is the seasonally high month for tourist arrivals, indicating peak tourism during this month.
Solution of Year 2018
- What is random sampling?
It is the sampling technique in which each unit in the population has an equal chance of being selected. This is also known as the equal probability sampling. - Write four major indicator of tourism statistics.
The four major indicator of tourism statistics are:
a. Number of tourist arrivals
b. Tourist expenditure
c. Length of stay
d. Occupancy rate
For more:
e. Tourist demographics like age, gender, nationality, etc.
f. Tourist satisfaction
g. Tourism revenue - Find the combined mean from the following information:
| Mean No. of observation | x̄1 = 50 n1 = 25 | x̄2 = 60 n2 = 30 |
Solution
Here,
x̄1 = 50
x̄2 = 60
n1 = 25
n2 = 30
We know,
Combined mean, x̄12 = (n1x̄1 + n2 x̄2 ) /( n1 + n2)
= (25 * 50 *+ 30 * 60) / (25 + 30)
= (1250 +1800) / 55
= 3050/ 55
= 55.46
- What is the probability of getting sum of 7 in throwing two dice?
Solution
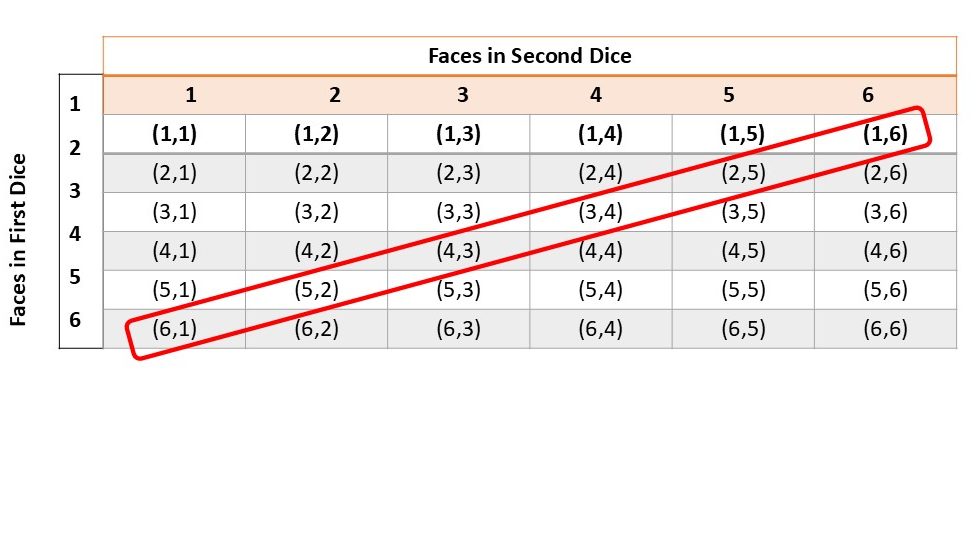
Here,
Total number of outcomes (m) = 6 * 6 = 36
Favorable outcomes of getting sum of 7 (n) = (6,2) (5,2) (4,3) (3,4) (2,5) (1,6)
= 6
Now,
The probability of getting a sum of 7 is the ratio of the number of favorable outcomes to the total number of possible outcomes:
= n / m
= 6 /36
= 1 /6
Hence, the probability of getting a sum of 7 when throwing two dice is 1/6 or 0.1667.
- If Sk (P) = 0.5, S.D. = 2, and median = 20, find mean.
Solution
Given,
Sk (P) = 0.5
S.D. = 2
median = 20
We know,
Sk = 3 (Mean – Median) / σ
or, 0.5 = 3 (Mean – 20) / 2
or, 0.5 * 2 = 3Mean – 60
or, 1 = 3Mean -60
or, 3Mean = 1 + 60
or, Mean = 61 / 3
∴ Mean = 20.33 - The difference between the upper quartile and lower quartile of a certain frequency distribution is 4 and their sum is 16. Calculate the coefficient of quartile deviation.
Solution
Given,
Q3 – Q1 = 4
Q3 +Q1 = 16
Now,
Adding both equation
Q3 – Q1 = 4
+ Q3 +Q1 = 16
—————
2Q3 = 20
∴ Q3 = 10
Keeping value of Q3 in equation (i)
Q3 – Q1 = 4
or, 10 – Q1 = 4
or, Q1 = 6
We know,
Coefficient of Quartile Deviation= (Q3 – Q1) / (Q3 + Q1)
= (10 – 6) /( 10 + 6)
= 4 / 16
= 0.25
∴ Hence, the coefficient of quartile deviation is 0.25.
- Differentiate between primary and secondary data.
The differences between primary and secondary data are:
| Primary Data | Secondary Data |
|---|---|
| Primary data are original in the sense that they are personally collected by the investigator or researcher involving himself or herself. | Secondary data are not original in the sense that they are collected by some one other than the investigator or researcher. |
| Primary data collection is more expensive and exhaustive. | It is less expensive. |
| They are collected as per requirement of the investigator. | Secondary data might have been collected with different objectives |
| Primary data may be influenced by personal prejudice of the investigator, etc. | Secondary data may not be influenced by the personal prejudice of the investigator. |
- Find the coefficient of correlation if bXY = 0.47 and bYX = 0.61.
Solution
Given,
bXY = 0.47
bYX = 0.61
We know the formula,
r = √ (bXY . bYX )
where,
bXY is the regression of X on Y
bYX is the regression of Y on X
= √ 0.47 . 0.61
= √ 0.2867
= 0.53544
≈ 0.54 - What are the components of time series data?
The components of time series data are:
A. Secular trend or long term movement
B. Periodic changes or short-term fluctuations
i. Seasonal Variation
ii. Cyclic Variation
C. Random or irregular movement - Write four advantages of sample survey over census survey.
The four advantages of sample survey over census survey are:
a. Cheaper: Costs less to conduct.
b. Faster: Results come quicker.
c. Easier: Less data to handle.
d. Practical: More feasible for large populations - The manager at Bakery Café selected a random sample of 50 customers’ waiting time (in minute) as follows.
| 29 | 28 | 51 | 43 | 24 | 40 | 52 | 72 | 41 | 23 |
| 25 | 30 | 22 | 34 | 19 | 31 | 29 | 45 | 45 | 24 |
| 60 | 48 | 19 | 47 | 54 | 68 | 17 | 43 | 23 | 56 |
| 39 | 40 | 43 | 48 | 56 | 42 | 21 | 36 | 24 | 65 |
| 60 | 31 | 50 | 31 | 47 | 43 | 30 | 32 | 35 | 39 |
Solution
Arranging the given data in ascending order:
17,19,19,21,22,23,23,24,24,24,25,28,29,29,30,30,31,31,31,32,34,35,36,39,39,40,40,41,42,43,43,43,43,43,45,45,47,47,47,48,48,50,51,52,54,56,56,60,60,65,68,72
Here, total number of observations (n) = 50
We know
First Quartile Position (Q1) = (n + 1) / 4 item
= (50 + 1) / 4
= 51 / 4
= 12.75 item
The first quartile will lie between the 12th and 13th values in the ordered dataset.
Here, the 12th value is 28 and the 13th value is 29. So,
∴ Q1 = 12th item + 0.75 (13th – 12th) item
= 28 + 0.75(29−28)
= 28.75
Second Quartile Position (Q2) = (n + 1) / 2 item
= (50 + 1) / 2
= 51 / 2
= 25.5 item
The second quartile will lie between the 25th and 26th values in the ordered dataset.
The 25th value is 39 and the 26th value is 40. So,
∴ Q2 = 25th item + 0.5 (26th – 25th) item
=39+0.5(40−39)
= 39.5
Third Quartile Position (Q3) = 3 (n + 1) / 4 item
= 3 (50 + 1) / 4
= 3 * 51 / 4
= 153 / 4
= 38.25 item
The third quartile will lie between the 38th and 39th values in the ordered dataset.
The 38th value is 47 and the 39th value is 47. So,
∴ Q3 = 47 ((since the values are the same)
Conclusion:
Q1 (First quartile): 28.75
Q2 (Second quartile or median): 39.5
Q3 (Third quartile): 47.
- The department store has been expanding market share during the past 7 years, posting the following gross sales in millions of rupees.
| Year | 2010 | 2011 | 2012 | 2013 | 2014 | 2015 | 2016 |
| Profit (in million Rs) | 14.8 | 20.7 | 24.6 | 32.9 | 37.8 | 47.6 | 51.7 |
- A bag contains 5 red, 3 black and 2 white balls. Two balls are drawn at random. What is the probability of drawing (i) both red balls and (ii) both black balls.
Solution
Given information are:
number of red balls = 5
number of blackballs = 3
number of white balls = 2
Total number of balls in bag = 5 + 3 + 2 = 10
Now,
Total number of ways of drawing 2 balls from all 10 balls
i.e. Total number of exhaustive cases (n) = 10c2 = 45
| Hints: Please check Year 2022, Question 3 to know how we did above calculations in easiest way using calculator. We have explained step by step process in that question |
(i) both red balls
To have both red balls we need:
Favorable number of cases of getting 2 red balls out of 5 red balls (m)
= 5c2
= 10
Now,
The required probability of drawing 2 red balls is
= Favorable number of cases/ Total number of cases
= 10 /45
=2 / 9
(ii) both black balls
Favorable number of cases of getting 2 black balls out of 3 black balls (m)
= 3c2
= 3
Now,
The required probability of drawing 2 black balls is
= Favorable number of cases/ Total number of cases
= 3/45
= 1 / 15
- An incomplete distribution is given below, average marks is 30.2. Find the missing frequencies.
| Marks | 0 – 10 | 10 – 20 | 20 – 30 | 30 – 40 | 40 – 50 | Total |
| No. of Students | 4 | – | 10 | – | 10 | 50 |
Solution
| Marks | Mid Value (X) | f | fx |
|---|---|---|---|
| 0 – 10 10 – 20 20 – 30 30 – 40 40 – 50 | 5 15 25 35 45 | 4 a 10 b 10 | 20 15a 250 35b 450 |
| N = 24 + a + b | ∑fx = 720 + 15a + 35b |
Given information,
N = 50
N = 24 + a + b
50 = 24 + a + b
or, a + b = 50 – 24
∴ a + b = 26 —— Equation i (Suppose)
We know,
Mean (x̄) = ∑fx / n
or, 30.2 = (720 + 15a + 35b) / 50
or, 30.2 * 50 = 720 + 15a + 35b
or, 1510 = 720 + 15a + 35b
or, 1510 – 720 = 15a + 35b
or, 790 = 15a + 35b —- Equation ii (Suppose)
Multiplying equation (i) by ’15’
15 (a + b) = 15 * 26
or, 15a + 15b = 390
Subtracting multiplied equation i from equation ii
790 – 390 = 15a + 35b -(15a + 15b)
or, 400 = 15a + 35b -15a – 15b
or, 400 = 20b
or, b = 400 / 20
∴ b = 20
Keeping value of b in equation ii
790 = 15a + 35b
or, 790 = 15a + 35 * 20
or, 790 = 15a + 700
or, 790 – 700 = 15a
or, 90 =15a
or, 90 / 15 = a
∴ a = 6
Hence, the missing frequencies are 6 and 20.
- The following distribution shows the quarterly enrollment figures for the previous five years of a campus:
| Year | Spring | Summer | Fall | Winter |
| 2009 | 220 | 203 | 193 | 84 |
| 2010 | 235 | 208 | 206 | 76 |
| 2011 | 236 | 206 | 209 | 73 |
| 2014 | 241 | 215 | 206 | 92 |
| 2015 | 239 | 221 | 213 | 115 |
b. Which quarter is seasonally low and which seasonally high for admission?
Solution
| Year | Spring | Summer | Fall | Winter |
|---|---|---|---|---|
| 2009 2010 2011 2014 2015 | 220 235 236 241 239 | 203 208 206 215 221 | 193 206 209 206 213 | 84 76 73 92 115 |
| Seasonal total | 1171 | 1053 | 1027 | 440 |
| Seasonal Average | 234.2 | 210.6 | 205.4 | 88 |
| Seasonal index | 126.90 | 114.11 | 111.30 | 47.69 |
Average of averages (overall average) = (175 + 181.25 + 181 + 188.5 +197) /5
= 922.75 / 5
= 184.55
Calculation of seasonal indices
Seasonal indices for 2009 = ( 234.2 / 184.55 )* 100
= 126.90
Seasonal indices for 2010 = ( 210.6 / 184.55 )* 100
= 114.11
Conclusion:
Spring is the seasonally high quarter for admissions with an index of 126.90.
Winter is the seasonally low quarter for admissions with an index of 47.69.
- From the following distribution:
a. Find the mean
b. Find the median
c. Based on the result in (a), and (b), what can you say about the nature of distribution?
| Class | 1 – 3 | 4 – 6 | 7 – 9 | 10 – 12 | 13 – 15 | 16 – 18 | 19 – 21 | 22 – 24 |
| Frequency | 18 | 90 | 44 | 23 | 9 | 7 | 5 | 4 |
- The scores of a sample of students on entrance examination and cumulative grade point average (GPA) at graduation is given below:
| Student | A | B | C | D | E | F | G | H | I |
| Entrance exam score | 74 | 69 | 85 | 63 | 82 | 60 | 79 | 91 | 99 |
| Cumulative GPA | 2.6 | 2.2 | 3.4 | 2.3 | 3.1 | 2.1 | 3.2 | 3.8 | 4.0 |
b. Estimate the CGPA for the student who scores 88 in the entrance examination.
- The following table shows the amplitude test score of 17 men and 15 women:
| Men | 87 | 68 | 92 | 79 | 83 | 67 | 71 | 92 | 112 |
| 75 | 77 | 102 | 79 | 78 | 85 | 75 | 72 | ||
| Women | 101 | 100 | 87 | 95 | 98 | 81 | 117 | 107 | 103 |
| 97 | 90 | 100 | 99 | 94 |
Solution of Year 2019
- What is Sampling?
Sampling can be defined as the selection of some units or parts of an aggregate or totality in such a way that some of these parts or units can represent the totality in such a way that some of these parts or units can represent the totality under study. - Write four major indicator of tourism statistics?
Repeated Question from Year 2018, Question no. 2 (Please refer back to that year) - Find the combined mean from the following information.
| Group A | Group B | |
|---|---|---|
| Mean | 20 | 25 |
| No. of Observation | 100 | 125 |
- A bag contains 3 red, 6 white and 7 blue balls. What is the probability that two balls drawn are white and blue?
Solution
Given information are:
number of red balls = 3
number of white balls = 6
number of blue balls = 7
Total number of balls in bag = 3 + 6 + 7 = 16
Now,
Total number of ways of drawing 2 balls from all 16 balls
i.e. Total number of exhaustive cases (n) = 16c2 = 120
Again,
Favorable number of cases of getting 1 white ball out of 6 red balls (m)
= 6c1
= 6
and,
Favorable number of cases of getting 1 blue ball out of 7 blue balls (m)
= 7c1
= 7
Number of favorable outcomes (1 white and 1 blue ball) i.e. n
= 6 * 7
= 42
Now,
The required probability of drawing 2 red balls is
= Favorable number of cases/ Total number of cases
= 42 /120
= 7 / 20
- If Sk (P) = 0.5, S.D. = 2, and median = 20, find mean
- The difference between the upper quartile and lower quartile of a certain frequency distribution is 4 and their sum is 16. Calculate the coefficient of quartile deviation.
- If bYX = -0.675 and bXY = -0.475, find the coefficient of correlation.
- Define variable and write its types with one example of each.
Variable is a characteristic, number, or quantity that can be measured or counted and can take on different values.
The types of variable are:
i. Discrete : For example – Number of students in a class (e.g., 25, 30)
ii. Continuous : For example – Temperature, height, weight, etc. - What are the components of time series data?
Repeated Question from Year 2018 Question no. 9 (Please refer back to that year) - Write four advantages of sample survey over census survey.
Repeated Question from Year 2018 Question no. 10 (Please refer back to that year) - A famous restaurant in Kathmandu uses a questionnaire to ask customers how they rate the server, food quality, cocktails, prices and atmosphere at the restaurant. Each characteristic is rated on a scale of outstanding (O), very good (V), good (G), average (A), and poor (P). The result of surveying 50 customers shows the following responses:
| G | O | V | G | A | O | V | O | V | G |
| O | V | A | V | O | P | V | O | G | A |
| O | O | O | G | O | V | V | A | G | O |
| V | P | V | O | O | G | O | O | V | O |
| G | A | P | V | O | O | G | V | A | G |
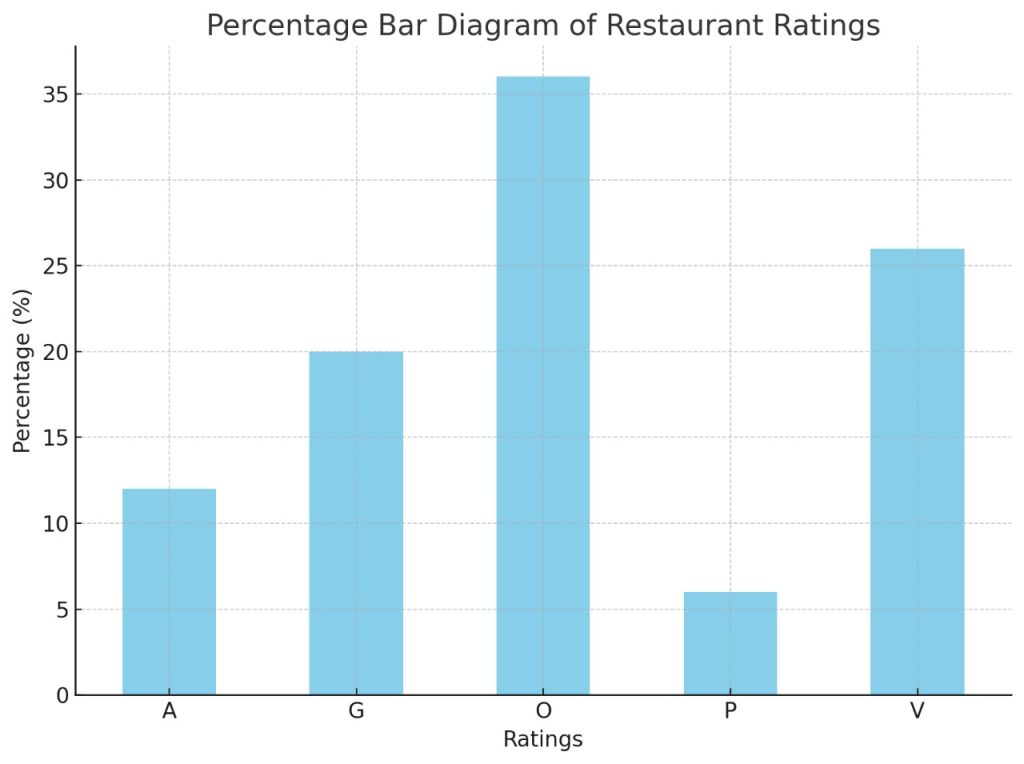
b. Draw a percentage bar diagram.
Solution
| f | |
|---|---|
| Outstanding (O) Very Good (V) Good (G) Average (A) Poor (P) | 18 13 10 6 3 |
- The following data represent the length of life in years, measured to the nearest tenth, of 30 similar led bulbs.
| 2.0 | 3.0 | 0.3 | 3.3 | 1.3 | 0.4 | 0.2 | 3.0 | 5.5 | 6.5 |
| 0.2 | 2.3 | 1.5 | 4.0 | 5.9 | 1.8 | 4.7 | 0.7 | 4.5 | 0.2 |
| 1.5 | 0.5 | 2.5 | 5.0 | 1.0 | 6.0 | 5.6 | 6.1 | 1.2 | 0.2 |
b. What is the shape of the distribution? The life of the led bulbs is of inferior quality or superior quality.
- The department store has been expanding market share during the past 7 years, posting the following gross sales in millions of rupees.
| Year | 2011 | 2012 | 2013 | 2014 | 2015 | 2016 | 2017 |
| Profit (lakhs Rs) | 14.8 | 20.7 | 24.6 | 32.9 | 37.8 | 47.6 | 51.7 |
b. Calculate the yearly average increment of profit and monthly average increment of profit.
(c) Estimate the likely profit for the year 2018
- The chance that A can solve a certain problem in Statistics is 2/3; the chance that B can solve it is 3/4. If they both try, find the probability that:
a. A solves it but B can’t
b. B solves it but A can’t
c. Both of them can’t solve it
d. At least one of them will solve it.
- The following data represents the sales (in millions of rupees) for a large department store for the 12 months of last three years.
| Month | 1993 | 1994 | 1995 |
| January | 7.2 | 8.2 | 6.4 |
| February | 8.5 | 9.1 | 7.3 |
| March | 9.6 | 10.5 | 8.5 |
| April | 10.2 | 11.4 | 10.2 |
| May | 11.7 | 12.0 | 10.8 |
| June | 13.0 | 14.5 | 15.0 |
| July | 14.2 | 14.0 | 13.0 |
| August | 15.7 | 16.2 | 15.0 |
| September | 11.4 | 12.0 | 11.8 |
| October | 9.3 | 9.0 | 8.6 |
| November | 12.3 | 9.8 | 11.0 |
| December | 9.3 | 7.3 | 6.3 |
b. Which month requires more business promotions?
- The administrator of the hotel surveyed the no. of days 200 randomly chosen customer stayed in the hotel in the season. The data are given below.
a. What is the minimum no. of days stayed in the hospital by top 30% of customers?
b. What is the range of no. of stays for middle 40% of customers?
- A firm administers a test to sales trainees before they go into the field. The management of the firm is interested in determining the relationship between the test scores and the sales made by the trainees at the end of one year in the field. The following data were collected for 10 sales personal who have been in the field for one year.
| Sales Person | A | B | C | D | E | F | G | H | I | J |
| Test Score | 2.6 | 3.7 | 2.4 | 4.5 | 2.6 | 5.0 | 2.8 | 3.0 | 4.0 | 3.4 |
| No. of units sold | 95 | 140 | 85 | 180 | 100 | 195 | 115 | 136 | 175 | 150 |
b. Develop the least square regression line that could be used to predict sales from trainee test scores.
c. How much does the average number of units sold increase, for each one-point increase in a trainee’s test score?
d. Estimate the number of units sold by the person who has average test score.
- Two automatic filling machines A and B are used to fill tea in 500 grams bag. A random sample of 100 bag on each machine showed the following results:
| Tea Contents (in gm) | Machine A | Machine B |
| 485 – 490 | 12 | 10 |
| 490 – 495 | 18 | 15 |
| 495 – 500 | 20 | 24 |
| 500 – 505 | 22 | 20 |
| 505 – 510 | 24 | 18 |
| 510 – 515 | 4 | 13 |
| Total | 100 | 100 |
a. Average filling
b. Variability in filling
c. Consistency in filling
Solution of Year 2022
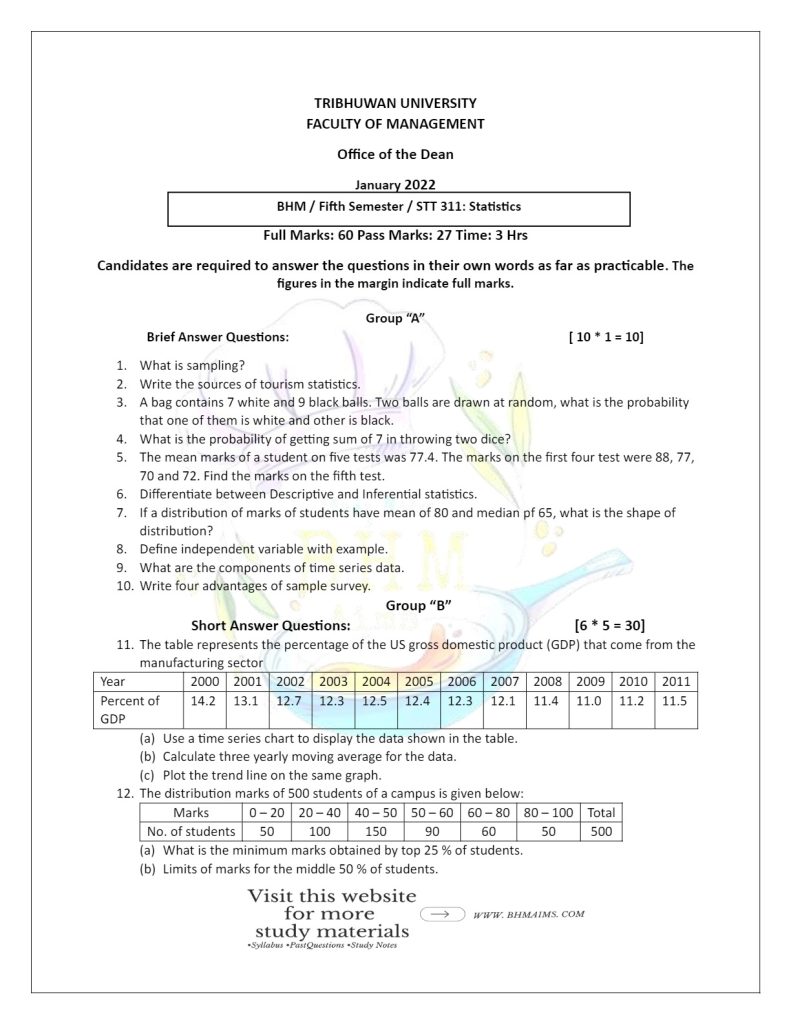
- What is sampling?
Repeated Question from Year 2019 Question no. 1 (Please refer back to that year) - Write the sources of tourism statistics.
The sources of tourism statistics are:
A. National Tourism Authorities and Ministries:
Example: Nepal Tourism Board (NTB)
B. Customs and Immigration Department
C. International Organizations- World Tourism Organization (UNWTO)
- World Travel and Tourism Council (WTTC)
- International Civil Aviation Organization (ICAO): Offers statistics on air travel, including passenger traffic related to tourism.
- A bag contains 7 white and 9 black balls. Two balls are drawn at random, what is the probability that one of them is white and other is black.
Solution:
Total number of white balls = 7
Total number of black balls = 9
Total number of balls = 7 + 9 = 16
Now,
Total number of cases (n) = 16c2 = n! / [(n! – r!)r!]
= 16! / (16! – 2!)2!
= 16! /( 14! 2!)
= 16 * 15 * 14 ! / (14! 2!)
= 16 * 15 / 2
= 240 / 2
= 120
HINTS:
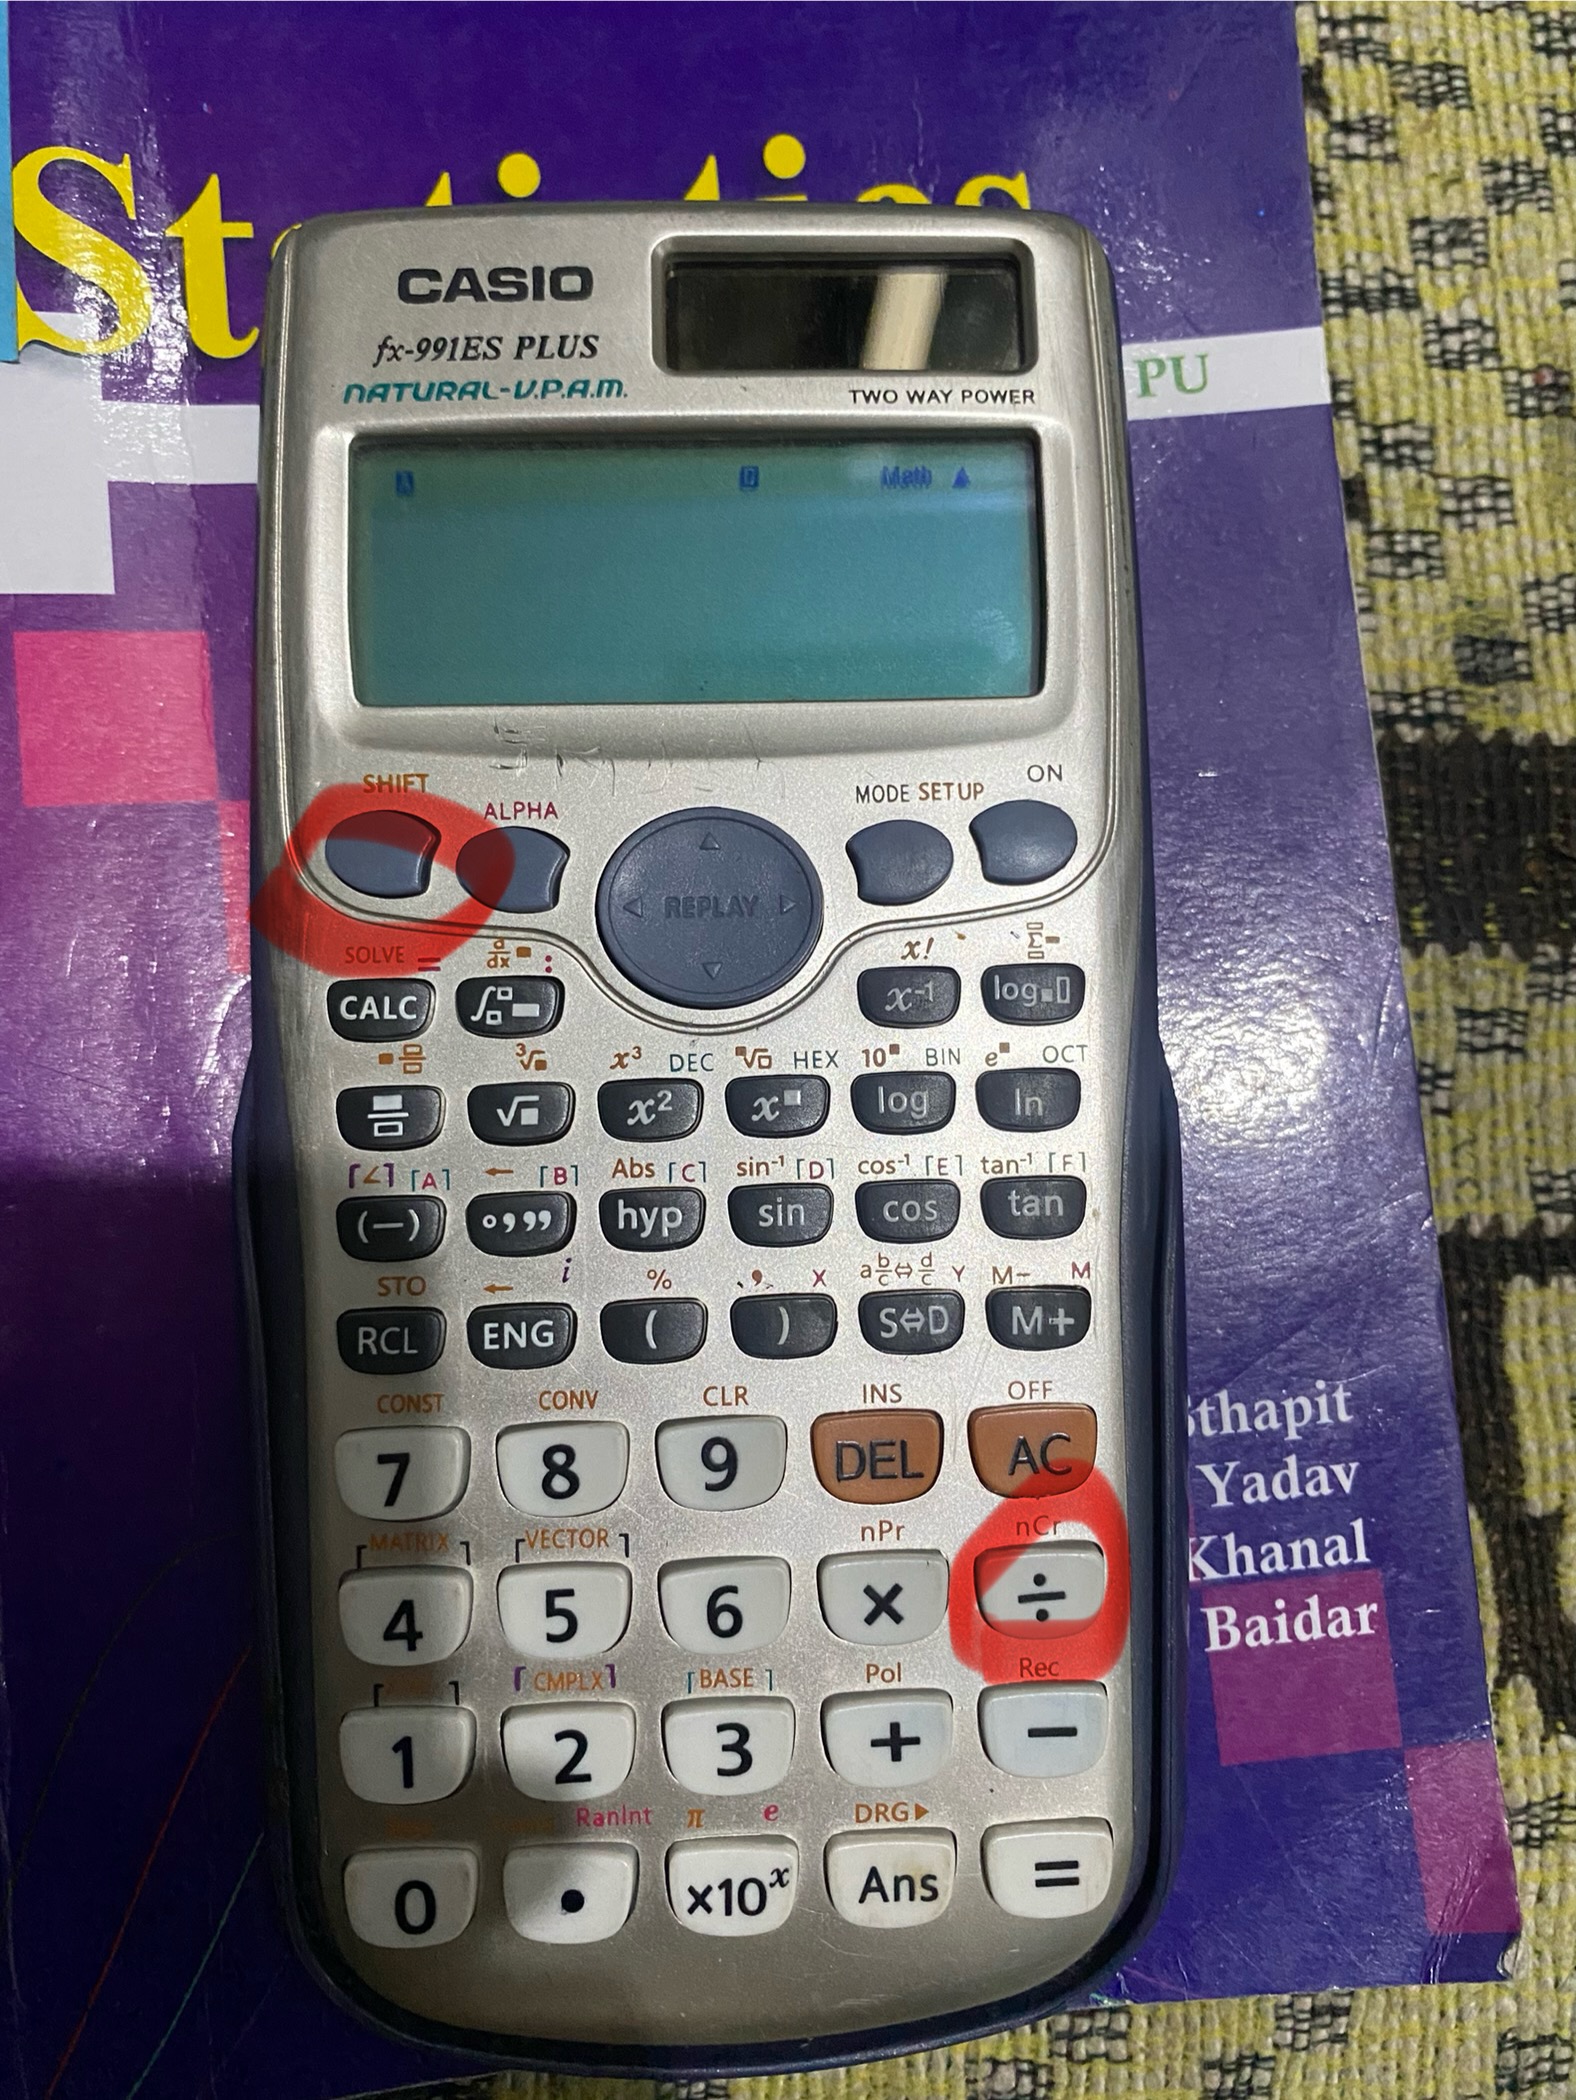
Instead of calculating total number of cases by using formula, you can also do above calculation directly from calculator for saving time.
For so,
– enter total number of balls first and press Shift + ÷ sign and enter total number of balls drawn
For example in above calculation we did:
- First we entered 16 and pressed Shift + ÷ and again we entered 2
- Hence final answer directly comes 120
Note: This is steps for calculator shown in the picture. If you have any other types of calculator then you can search nCr which means combination and you can do from that also.
Again, we have to calculate favorable number of cases
To have one white ball and one black ball, we can choose:
Favorable number of cases of getting 1 white ball out of 7 white balls (m) = 7c1 = 7
Favorable number of cases of getting 1 black ball out of 9 white balls (m) = 9c1 = 9
The number of favorable outcomes (one white and one black) is the product of these two:
= 7 * 9
= 63
Atlast,
The probability that one ball is white and the other is black is the ratio of the number of favorable outcomes to the total number of outcomes:
= Total number of favorable outcomes / Total number of outcomes
= 63 / 120
= 21 / 40
Hence, The probability that one of the balls drawn is white and the other is black is 21/40 or 0.525.
- What is the probability of getting sum of 7 in throwing two dice?
Repeated Question: This question is solved in Year 2018, Question no. 4 (Please refer back to that year)
- The mean marks of a student on five tests was 77.4. The marks on the first four test were 88, 77, 70 and 72. Find the marks on the fifth test.
- Differentiate between Descriptive and Inferential statistics.
| Basis | Descriptive Statistics | Inferential Statistics |
|---|---|---|
| Definition | Summarizes and describes the features of a dataset. | Makes predictions or inferences about a population based on a sample. |
| Data Type | Works with the entire population or a sample to describe data. | Uses a sample to predict characteristics of a larger population. |
| Examples | Calculating the average score of a class, presenting data in graphs, finding the median income in a dataset. | Predicting average score for all students based on a sample. |
| Scope | Stays within the data. | Extends beyond the data to make broader claims. |
| Results | Gives exact details about your data. | Gives probable answers, but with some uncertainty. |
- If a distribution of marks of students have mean of 80 and median pf 65, what is the shape of distribution?
- Define independent variable with example.
- What are the components of time series data.
Repeated Question from Year 2018 Question no. 9 (Please refer back to that year)
- Write four advantages of sample survey.
The four advantages of sample survey are:
a) Saves Money: It costs less than surveying everyone.
b) Quicker: Results come faster because you survey fewer people.
c) Easier to Handle: Managing and analyzing a smaller amount of data is simpler.
d) Practical: Sometimes, it’s just not possible to survey everyone, so a sample is more doable. - The table represents the percentage of the US gross domestic product (GDP) that come from the manufacturing sector.
| Year | 2000 | 2001 | 2002 | 2003 | 2004 | 2005 | 2006 | 2007 | 2008 | 2009 | 2010 | 2011 |
| Percent of GDP | 14.2 | 13.1 | 12.7 | 12.3 | 12.5 | 12.4 | 12.3 | 12.1 | 11.4 | 11.0 | 11.2 | 11.5 |
b. Calculate three yearly moving average for the data.
c. Plot the trend line on the same graph.
- The distribution marks of 500 students of a campus is given below:
| Marks | 0 – 20 | 20 – 40 | 40 – 50 | 50 – 60 | 60 – 80 | 80 – 100 | Total |
| No. of students | 50 | 100 | 150 | 90 | 60 | 50 | 500 |
b. Limits of marks for the middle 50 % of students.
- A restaurant manager wishes to improve customer service and employee scheduling based on the daily levels of customers in the past 4 weeks. The numbers of customers served in the restaurant during that period were:
| Mon | Tue | Wed | Thu | Fri | Sat | Sun | ||
| Week | 1 | 345 | 310 | 385 | 416 | 597 | 706 | 653 |
| 2 | 418 | 333 | 400 | 515 | 664 | 761 | 702 | |
| 3 | 393 | 387 | 311 | 535 | 625 | 598 | 598 | |
| 4 | 406 | 412 | 377 | 444 | 650 | 803 | 822 | |
- Calculate Karl Pearson’s correlation coefficient between the ages of the husbands and the ages of wife of a sample of 10 tourists.
| Husband’s age | 23 | 22 | 24 | 23 | 26 | 27 | 28 | 20 | 30 | 20 |
| Wife’s age | 20 | 18 | 20 | 21 | 21 | 22 | 24 | 23 | 25 | 26 |
- 100 students took a test. The distribution of marks of those who secured less than 60 % are given below.
| Marks | 0 – 20 | 20 – 40 | 40 – 60 | Total |
| No. of students | 16 | 24 | 30 | 70 |
- The following information is related to X = Advertisement expenditure and Y = sales.
| Descriptive Measure | Advertisement Expenditure (Rs Lakhs) | Sales (Rs Lakhs) |
| Mean | 10 | 90 |
| Standard Deviation | 3 | 12 |
| Correlation Coefficient | 0.8 | |
b. What should be the advertisement expenditure if the company wants to attain a sale target of Rs 120 lakhs?
- The manager at Bakery Café selected a random sample of 50 customers waiting time is recorded as follows.
| Waiting Time (in minutes) | 16 – 24 | 24 – 32 | 32 – 40 | 40 – 48 | 48 – 56 | 56 – 64 | 64 – 72 | 72 – 80 | Total |
| Frequency | 7 | 12 | 7 | 11 | 6 | 4 | 2 | 1 | 50 |
b. Find the median waiting time of customer
c. Find the standard deviation of waiting time of customer
d. Find the Karl Pearson’s second coefficient of skewness and comment on the nature of distribution.
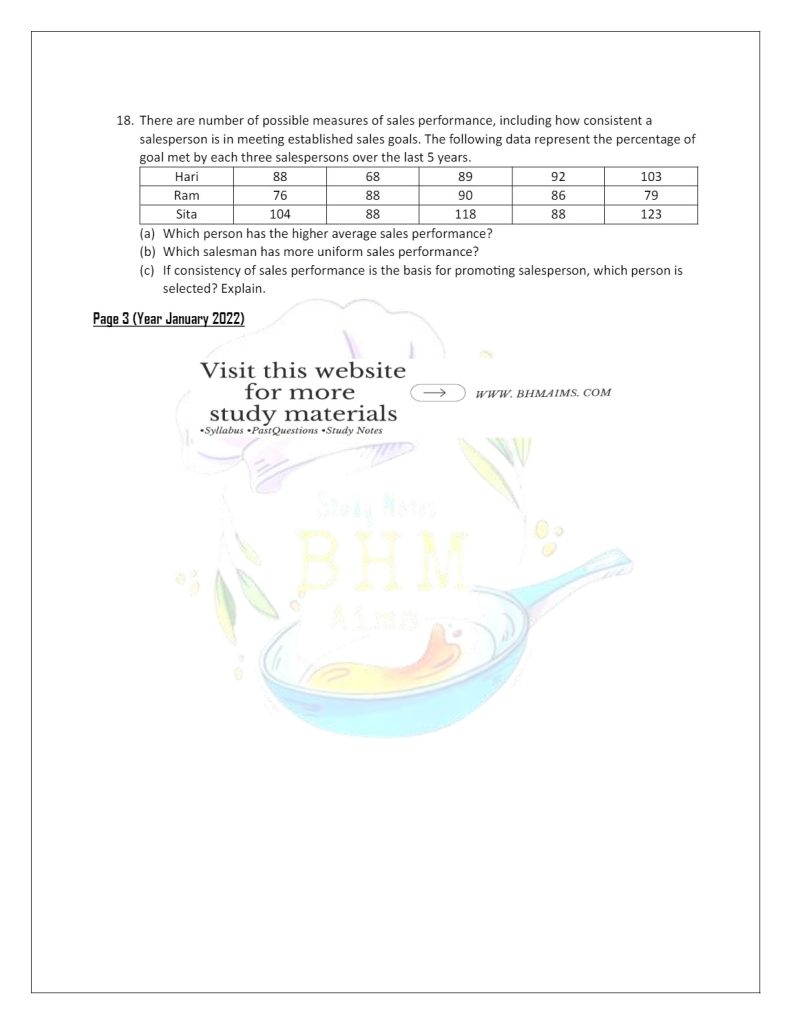
- There are number of possible measures of sales performance, including how consistent a salesperson is in meeting established sales goals. The following data represent the percentage of goal met by each three salespersons over the last 5 years.
| Hari | 88 | 68 | 89 | 92 | 103 |
| Ram | 76 | 88 | 90 | 86 | 79 |
| Sita | 104 | 88 | 118 | 88 | 123 |
b. Which salesman has more uniform sales performance?
c. If consistency of sales performance is the basis for promoting salesperson, which person is selected? Explain.
Solution of Year 2023
- Define statistics.
Statistics may be defined as the collection, presentation, analysis and interpretation of numerical data. - In a asymmetrical distribution, mean=50 and median=45. Calculate the value of mode.
- What is random experiment?
An experiment is any kind of activity which generates data. If an experiment performed a large number of time under essentially an identical condition, the result may not unique but may be any one of the various possible outcomes is called random experiment.
(OR)
A random experiment is a process or action that leads to one of several possible outcomes, where the outcome cannot be predicted with certainty in advance. In other words, it is an experiment or process in which the outcome is determined by chance.
For example: Rolling a dice, flipping a coin, drawing a card from a deck, etc. - If upper quartile is 65 and lower quartile is 50, then calculate the quartile deviation.
- How the sample is different from the population?
Here is how sample is different from the population:
(Note: You should write only 2 from below points; below answer is for 5 marks)
| Aspect | Population | Sample |
|---|---|---|
| Definition | The entire group of individuals or items that you want to study or draw conclusions about. | A subset of the population selected for the actual study. |
| Size | Typically large, possibly infinite (e.g., all people in a country). | Smaller, manageable number of subjects from the population. |
| Representation | Represents all possible data points or individuals under study. | Represents only a portion of the population, chosen to reflect it. |
| Data Collection | Collecting data from a population is often impractical or impossible due to its size. | Data collection is more feasible and less costly. |
| Example | All students in a university. | 200 students selected from the university for a survey. |
- List out the components of time series.
Repeated Question from Year 2018 Question no. 9 (Please refer back to that year) - In a class of 50 students, 10 have failed and their average mark is 2.5. The total marks secured by the entire class were 281. Find the average marks of those who have passed.
- If mean=50 and standard deviation = 10, then calculate coefficient of variation.
- Karl Pearson’s coefficient of skewness of a distribution is 0.5. If the median and mode of the distribution are 42 and 36 respectively, find the coefficient of variation.
- The variance of X is 25, the standard deviation of Y is 15, and the regression coefficient of Y on X is -1.5. Find the value of the correlation between X and Y.
- Explain different types of non-probability sampling.
The different types of non-probability sampling are:
a. Judgement Sampling
In this sampling method, the choice of sampling items depends exclusively on the judgement of the investigator
Merits of judgement sampling:
i. This is the simple method of sampling.
ii. This is the only practical method of arriving a quick decision for urgent need.
iii. This is the better method when the sample size is small.
b. Convenience sampling
The investigator selects the samples on the basis of the convenience of the investigator. This is also known as chunk sampling, where a chunk or part of the population is selected without using any probability law.
c. Quota Sampling
In simple term, quota sampling can be considered as stratified sampling in which the principle of probability is not applied to select the sample units. Thus, it is a type of judgement sampling. Some quota are set up according to some criteria and selection of quota is made according to the personal judgement of the investigator or high level authorities.
- Following is the sample data of frequency distribution of daily income of 1250 staffs working in different hotels and resorts.
| Daily income (Rs) | No. of staffs |
| Below 1000 | 50 |
| 1000 – 1999 | 500 |
| 2000 – 2999 | 555 |
| 3000 – 3999 | 100 |
| 4000 – 4999 | 30 |
| 5000 & above | 15 |
Calculate:
a. The appropriate measure of central tendency with a reason.
b. Limits of income of middle 40 % of staffs.
- The top five most popular types of soft drinks served by the restaurant of a star hotel include Coke Classic, Diet Coke, Dr. Pepper, Pepsi, and Sprite. Assume that the data in the following table shows the soft drink selected in a sample of 50 soft drink purchases by the guests.
| Coke Classic | Sprite | Pepsi | Diet Coke | Coke Classic |
| Pepsi | Pepsi | Diet Coke | Coke Classic | Diet Coke |
| Coke Classic | Coke Classic | Coke Classic | Diet Coke | Pepsi |
| Pepsi | Coke Classic | Dr. Pepper | Dr. Pepper | Sprite |
| Diet Coke | Pepsi | Diet Coke | Pepsi | Coke Classic |
| Coke Classic | Coke Classic | Pepsi | Coke Classic | Coke Classic |
| Pepsi | Dr. Pepper | Coke Classic | Sprite | Pepsi |
| Sprite | Coke Classic | Pepsi | Coke Classic | Coke Classic |
| Coke Classic | Diet Coke | Dr. Pepper | Sprite | Diet Coke |
| Dr. Pepper | Pepsi | Coke Classic | Coke Classic | Pepsi |
(b) Construct a pie diagram from the above data.
- The probability that a man will be alive 25 years hence is 0·3 and the probability that his wife will be alive 25 years hence is 0·4. Find the probability that 25 years hence
- Both will be alive,
- Only the man will be alive,
- Only the woman will be alive,
- None will be alive 25 years hence,
- At least one of them will be alive.
Solution
Given,
Probability that a men will be alive 25 years, hence i.e.
P(M) = 0.3
P(M)c = 1 – 0.3 = 0.7
Probability that his women will be alive 25 years, hence i.e.
P(W) = 0.4
P(W)c = 1 – 0.4 = 0.6
a. Both will be alive,
Probability (both alive) i.e.
P(M∩W)= P(M) * P(W)
= 0.3 * 0.4
= 0.12
b. Only the man will be alive,
P(M∩Wc) = P(M) * P(Wc)
= 0.3 * 0.6
= 0.18
c. Only the woman will be alive
P(W∩Mc) = P(W) * P(Mc)
= 0.4 * 0.7
= 0.28
d. None will be alive 25 years hence
P(M’ ∩ W’) = P(Mc) * P(Wc)
= 0.7 * 0.6
= 0.42
e. At least one of them will be alive.
P (M or W) = P(M) + P(W) – P(M ∩ W)
= 0.3 + 0.4 – 0.12
= 0.58
- The following data is related to the tourist arrival in Nepal from different countries in 5 years.
| Year | 2017 | 2018 | 2019 | 2020 | 2021 |
| Numbers of tourists in lakh | 3 | 6 | 8 | 7 | 10 |
b. Estimate the expected number of tourists who will visit during 2022 and 2023.
- A goal of management is to earn as much as possible relative to capital invested in their company. One measure of the source of this effort is the return on equity – the ratio of net income to the stockholders’ equity. Shown here are the returns on equity percentages for 25 Companies.
| 9.0 | 19.6 | 22.9 | 41.6 | 11.4 | 15.8 | 52.7 | 17.3 |
| 12.3 | 5.1 | 17.3 | 31.1 | 9.6 | 8.6 | 11.2 | 12.8 |
| 12.2 | 14.5 | 9.2 | 16.6 | 5.0 | 30.3 | 14.7 | 19.2 |
| 6.2 | — | — | — | — | — | — | — |
