Concept of Tourism Demand
Simply, any requirement of tourism is known as tourism demand.
In economics, tourism demand can be defined as the quantity demand of tourism goods and services that the tourists are able and willing to purchase or consume during given time period at specific price, keeping other things constant.
Demand Function
In a mathematical language, function is the symbolic expression which shows the relationship between two or more interrelated variables – generally where one is dependent variable and others are independent variables.
Demand function can also be defined as the relationship between demand for the product (dependent variable) and its determinants (Independent variables).
A tourism demand function, where all variables occur at a given time period, t is
Dij = P, E, T, Y, RP, QF
Where,
| i = Original Place or origin j = Destination Place |
D = Demand of a tourism product
P = Price of the commodity
E = Exchange Rate
T = Transportation
Y = Income Level
RP = Relative price of the commodity
QF = Qualitative factor like mood
Demand function can be of following two types:
- Linear Demand Curve
- Non- Linear Demand Curve
- Linear Demand Curve
A demand function takes a linear form when the ratio of change in quantity demand due to change in price. i.e. ΔQij / ΔPijk , remains constant for all changes in price.
Linear demand curve equation is given as:
| Dij = a – b * Pij/k |
Where,
Dij = Tourism demand at origin i to destination j
a = intercept the demand curve makes with horizontal or quantity axis
b= Slope of the demand curve or the rate at which demand curve slopes downward. It is the ΔQ / ΔP. It measures the rate at which tourism demand changes with respect to its relative price.
Pij/k = Price in origin i to destination j

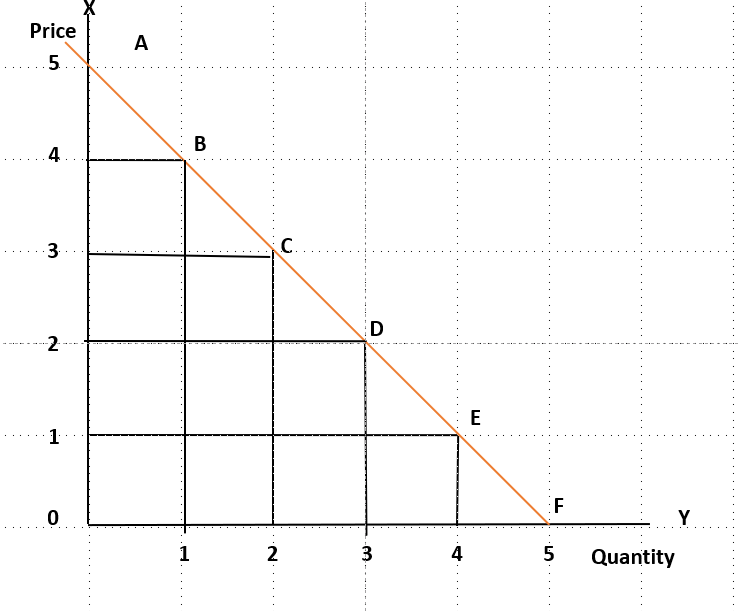
In the above figure, AF (Orange line) is the linear tourism demand curve, which is slope downward shows the inverse relationship between price and demand. At price 0, tourism demand is 5 units, which is autonomous demand (a). The slope of demand curve (b) is the ratio of change in quantity demand to the change in price ΔQij / ΔPjk
Characteristics of Linear Demand Curve
- It has a constant slope.
- The elasticity of demand changes along the curve; it is not constant.
- It is simpler to analyze and use for predictions.
- Non-Linear Demand Curve
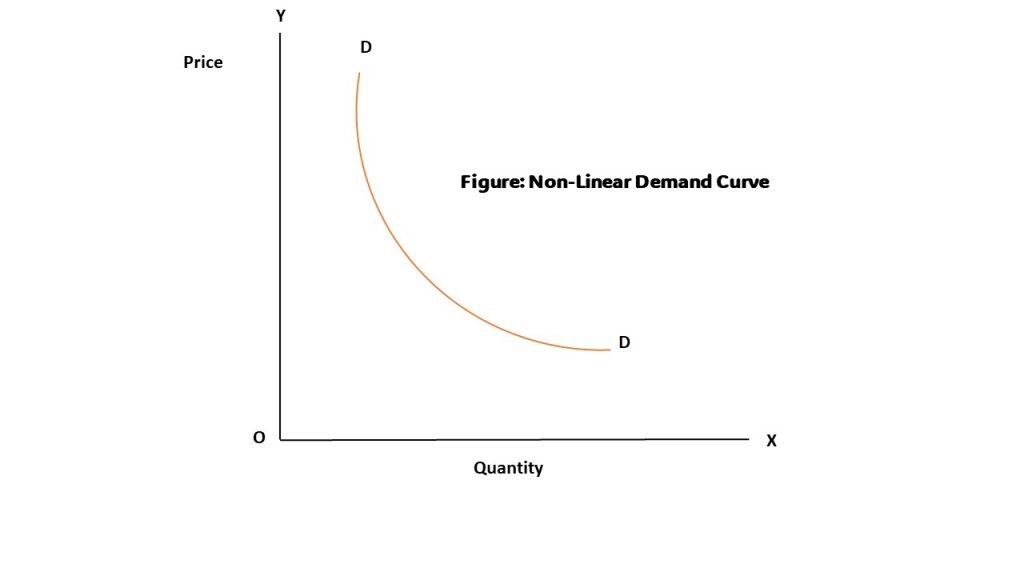
A demand function is said to be non-linear or curvilinear when the slope of a demand curve ΔQij / ΔPjk changes all along the demand curve. The non-linear demand curve is shown in figure below. A non-linear demand function, generally, takes the form of a power function as or of a rectangular hyperbola of the form
Qij = aPij-b
Qij = a/ Pij-b
Where, a,b > 0
Note that the exponent (-b) of the price in a non-linear demand function. It gives the measure the coefficient of price elasticity of demand. In case of rectangular hyperbola type of demand function, the elasticity of demand remains constant throughout . Therefore, demand function also called Constant Elasticity Demand Function.

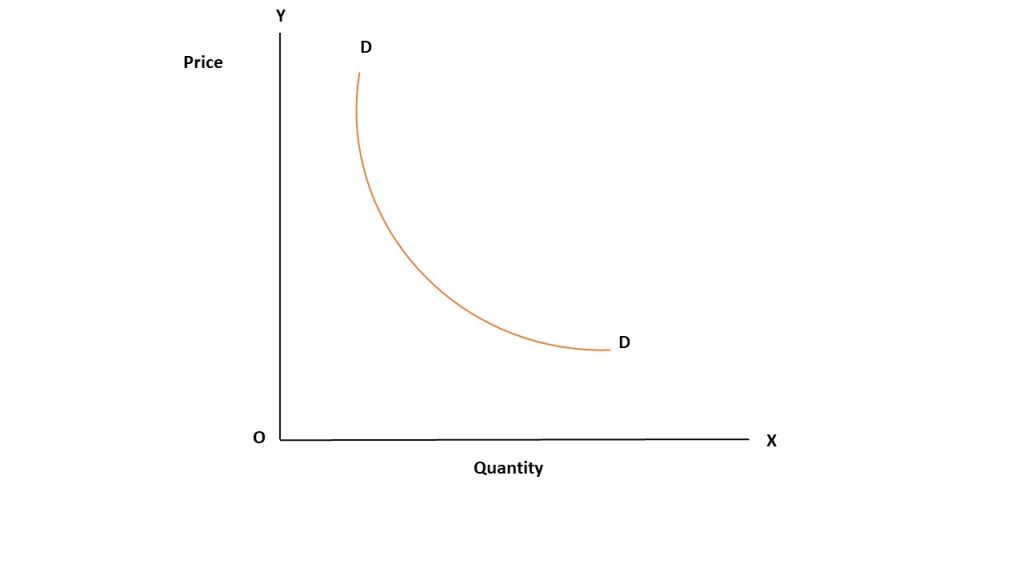
In the above figure, DD line shows the non-linear demand curve, which is slope downward shows the inverse relationship between price and quantity demand. Here, the slope of demand curve (b) is different at different point.
Characteristics of Non-Linear Demand Curve
- The slope is not constant; it varies at different points along the curve.
- Elasticity of demand can vary at different points along the curve.
- It can provide a more accurate representation of consumer behavior in many real-world situations.
Law of Demand
Law of demand states that the relationship between demand of commodity and price of commodity is inversely proportional, keeping other things constant. It means that the quantity demanded by an individual increases if the price of a commodity decreases and vice-versa.
(मतलव कुनै सामानको मूल्य बढ्छ भने, त्यो समान को माग i.e. demand घट्छ अनि सामान को मूल्य घट्छ भने, माग बढ्छ)
| D ∝ (1 / P) |
D = Demand of the commodity or product
P = Price of the commodity or product
For example, When the price of a popular smartphone drops from $1,000 to $800, more people will buy it. And, when the price increases from $1,000 to $1,200, fewer people buy it. This shows the law of demand: as the price decreases, the quantity demanded increases, and as the price increases, the quantity demanded decreases.
Assumptions of the law of demand
The law of demand is based on various assumptions that must hold true for the inverse relationship between price and quantity demanded to apply. These assumptions include:
- Ceteris Paribus (All Else Being Equal): The price of the related goods remains the same.
- The income of the tourist remains unchanged.
- Rational Behavior: Tastes and preferences of the tourist remains the same. Consumers make sensible decisions to get the most satisfaction. They buy more when prices drop and less when prices rise.
- All the units of the goods are homogenous.
- Commodity should be a normal goods. The law of demand doesn’t apply to Giffen goods, where higher prices might lead to higher demand.
- No Change in the Prices of Substitute and Complementary Goods
- No Anticipation of Future Price Changes: Consumers do not expect future price changes that would alter their current buying behavior. If consumers expect prices to rise in the future, they might buy more now, and if they expect prices to fall, they might delay their purchases.
- Constant Size of the Population: The population size and demographics are assumed to remain constant. Changes in population can affect the overall market demand.
Demand Schedule and Demand Curve
Demand schedule can be defined as the tabulation presentation of the law of demand. For example:
| Combination | Price of per rooms (Rs) | No. of rooms demanded |
|---|---|---|
| A | 1000 | 50 |
| B | 2000 | 40 |
| C | 3000 | 30 |
| D | 4000 | 20 |
| E | 5000 | 10 |
It is a tabular representation showing the different quantities of room that the tourist are willing to demand at different prices during a given time period.
Here, the demand schedule shows an inverse relationship between price and quantity demanded. When the price was Rs 1,000 per room, tourist are willing to buy 50 rooms but when the price increases to Rs 2,000, the number of rooms demanded decreased to 40 and so on. This shows that the lower the price, more will be the demand and vice versa.

The graphical representation of the demand function is known as demand curve. In above figure, the demand curve for rooms is drawn which shows different number of rooms demanded at different prices in a given time period.
Reasons Behind Downward Slope of the Demand Curve
- Law of diminishing marginal utility:
कुनै पनि सामानको प्रयोग धेरै समयसम्म गर्दै जादा, त्यसको satisfaction घट्दै जान्छ, त्यहिभएर downward slope हुन्छ | For example: तपाईलाई पहिलो chcolateको टुक्रा धेरै स्वादिष्ट लाग्छ, तर दोस्रो र तेस्रो टुक्रा खाँदा त्यति खुशी नमिल्न सक्छ। यसैले, chocolate को price घटाउँदा तपाई बढी चोकलेट किन्ने इच्छा राख्नुहुन्छ, र price बढाउँदा कम / थोरै chocolate किन्ने इच्छा राख्नुहुन्छ।
This law was formulated by Marshall and it states that as the consumer has more and more of a good, its marginal utility to him /her goes on declining. A consumer is not interested in buying more units of the same commodity at the same price. Instead, he is ready to pay a price equal to his marginal utility and marginal utility goes on diminishing. In other words, consumer is willing to pay a lesser price for more units of a good. This shows that demand curve is downward sloping.
(Note: In economics, word ‘utility’को मतलब कुनै product or service लिदा आफुलाई मिल्ने ‘satisfaction or pleasure’ भन्ने बुझनेगरिन्छ) - Substitution effect:
मानौँ, coffeeको price Rs 20 बाट Rs 25 per cup increase हुन्छ। यस कारण, coffee महँगो लाग्छ र चिया, जुन Rs15 per cupमा छ, सस्तो विकल्प i.e. alternative जस्तो लाग्न थाल्छ।
यस परिवर्तनको कारण, मानिसहरू अब coffeeको सट्टा बढी चिया किन्नेछन्, किनकि चिया अहिले कफीभन्दा सस्तो छ।
Substitution effect means with fall in the price of a good, consumer feels a rise in relative price of other goods, which on turn leads to more demand for the good. When the price of a good rises, consumer buys more of substitute goods and less of the goods whose price has risen. This shows inverse relationship between price and quantity demanded. - Income effect:
यदि तपाईको आम्दानी i.e. income increase हुन्छ भने, तपाई बढी सामान र सेवाहरू किन्न सक्नुहुन्छ वा उच्च गुणस्तरका वस्तुहरू purchase or consume गर्न सक्नुहुन्छ। For example, यदि तपाईको salary बढ्छ भने, तपाई महँगो रेस्टुरेन्टमा खाना खाने सम्भावना बढ्छ, जसले आय प्रभावलाई देखाउछ |
Income effect means with the fall in price of a commodity or goods, consumer’s real income or purchasing power rises and he demands more units of the good (normal good). Thus, when price falls, demand rises. Income effect is defined as the change in the optimal quantity of a good when the purchasing power changes consequently upon a change in the price of a good. - New consumers increasing demand:
मान्नुस पहिला एउटा bread किन्नलाई, Rs 20 पर्ने गर्थियो, त्यसैले जो मान्छेसंग Rs 10 मात्र हुन्थ्यो त्यसले त किन्न पाएन or सक्दैन। तर पछि त्यहि सामान को price घटेर Rs 10 पुग्यो भने त, उसले नि किन्न सक्छ सो उसले demand गर्छ र marketमा new demand generate हुन्छ |
When the price of the commodity falls, new consumer class also appears and who can now purchase or consume the commodity. Thus, the total demand for the commodity increases, i.e. with fall in price, quantity demanded rises.
Types of Variables or Factors Influencing Tourism Demand / Factor Causing Shift in Demand
- Income
- Tastes and preferences
- Cost of complementary goods
- Price
- Exchange rates
- Trade openness
- Population
- Attractiveness
Movement / Change in Quantity Demand
Change in combination of price and quantity demand of product due to change in own price of the product other things remains constant is movement along the demand curve.
मतलव कुनै पनि product को price change हुदा, product को price र quantity demand मा एकैतालमा changes आउछ भने त्यो movement along the demand curve हो |
Movement along the demand curve is caused by a change in the own price of the product, other things remaining constant. It is also called change in quantity demanded of the commodity. Movement is always along the same demand curve, i.e. no new demand curve is drawn.
Movement along a demand curve can have:
- Expansion of demand
- Contraction of demand
- Expansion of demand: It is also known as extension of demand which refers to the increase in demand due to fall in product price, other things remaining constant.
- Contraction of demand: It refers to the fall in demand due to rise in the price of the good, other things remaining constant.

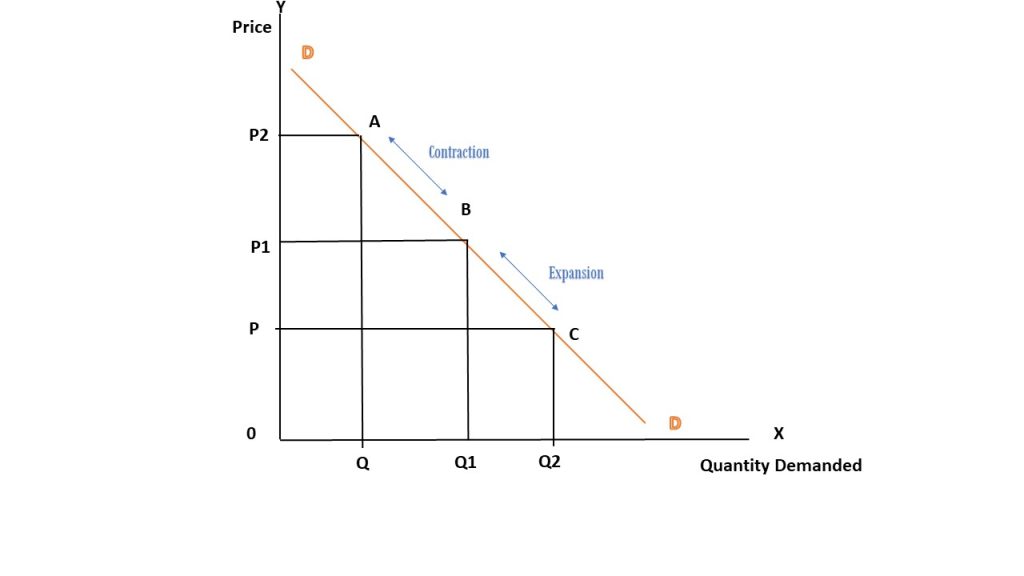
Here in the above graph, point B in the demand curve DD shows the original situation or midpoint or neutral state of price. When there is a movement of price from point B to point A it shows contraction while downward movement shows extension.
Important Questions
- What is tourism demand function?
- Explain various degrees of price elasticity of tourism demand. If the income of tourist increases from $4,000 to $5,000, the quantity demanded of tourism product increases from 10 units to 40 units. Compute income elasticity of tourism product?
- What is demand curce?
- Discuss types of variables influencing tourism demand.
- If the price of product A increases from Rs 400 to Rs 500 and the quantity demanded of product B decreases from 10 kg to 5 kg then calculate the cross elasticity of demand. Analyze the result and what recommendation do you provide for pricing decision?
- List out 4 factors that cause shifts in tourism demand curve.
- When income of the consumer increases from Rs 5,000 to Rs 10,000, quantity demanded increases from 500 units to 800 units, find the income elasticity of demand and interpret the result.
- List out any 4 factors that cause tourism demand curve to shift to right.
- Define cross elasticity of demand.
- Explain levels of choices affecting tourism demand.
- If the income of a tourist increases from Rs 8000 to Rs 10000 the quantity demanded of tourism product increases from 20 units to 40 units. Compute income elasticity of tourism product.
- If the income of consumer increases from Rs 400 to Rs 500 and the quantity demanded increases from 10 Kg to 5 Kg then calculate the income elasticity of demand. Analyze the result and what recommendation do you provide for pricing decisions?
- Quantity demanded of a commodity decreases from 250 kg to 150 kg due to increases in price of the commodity from Rs 500 to Rs 600. Find the price elasticity of demand and interpret the result.
